
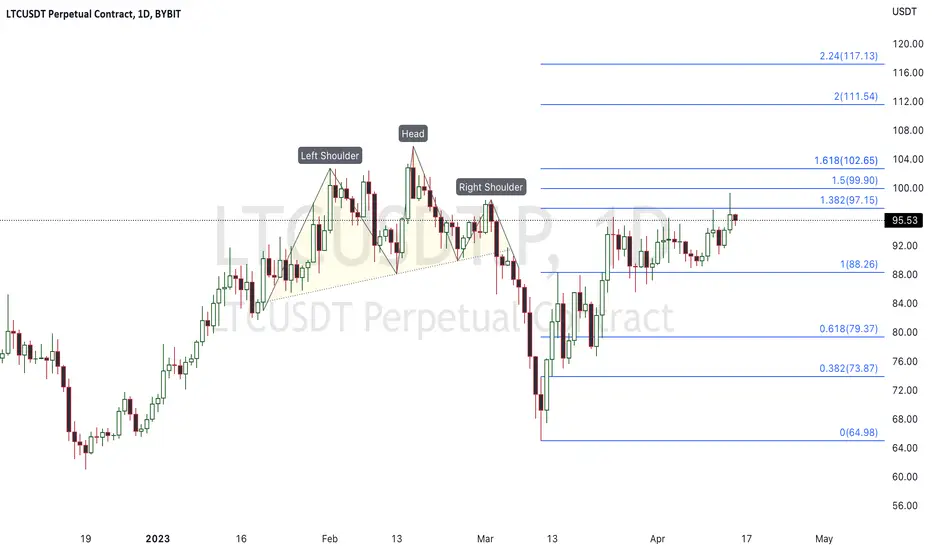
1D chart:
The H&S did not stop falling after falling to the target price of 73.99, and the lowest price reached 64.98. After the LTC stopped falling, it formed a bottom and broke through the neckline price of 88.26, showing an ascending triangle pattern.
Pay attention to the target price above:
99.90
102.65
111.54
117.13
-
4 hr chart cup-and-handle pattern:

After breaking through the neckline at 88.26, the price tested around 95.86 twice. The first step back to 85.53 was effectively supported, the second step back to the Fibonacci sequence of 0.382 (89.48), and then broke through the neckline 95.86, and the cup-handle was established.
Follow the goals above:
99.81
101.03
102.24
106.19
108.67
Stop loss: 88.88
-
Daily charts operate with spot or low leverage.
The 4 hr cup-and-handle pattern can be operated with a higher leverage to expand profit margins.
-
The H&S did not stop falling after falling to the target price of 73.99, and the lowest price reached 64.98. After the LTC stopped falling, it formed a bottom and broke through the neckline price of 88.26, showing an ascending triangle pattern.
Pay attention to the target price above:
99.90
102.65
111.54
117.13
-
4 hr chart cup-and-handle pattern:
After breaking through the neckline at 88.26, the price tested around 95.86 twice. The first step back to 85.53 was effectively supported, the second step back to the Fibonacci sequence of 0.382 (89.48), and then broke through the neckline 95.86, and the cup-handle was established.
Follow the goals above:
99.81
101.03
102.24
106.19
108.67
Stop loss: 88.88
-
Daily charts operate with spot or low leverage.
The 4 hr cup-and-handle pattern can be operated with a higher leverage to expand profit margins.
-
노트
99.81✅
101.03✅
102.24✅
106.19
108.67
The cup and handle pattern continues to move towards the goal!
거래청산: 스탑 닿음
Cup handle stop loss.노트
The ascending triangle pattern on the 1D chart of LTC is still valid, and the current price is on the neckline at 88.26.
There are still two price targets above:
111.54
117.13
노트
On the 4hr chart of LTC, a diamond pattern appears near the neckline 88.26, which means that LTC is consolidating. If there is an upward breakthrough, pay attention to 97.15, 99.0 and 102.65.
-
If it falls below, pay attention to 77.87~79.37.
The lowest price is possible to 73.87.
-

bybit sign up:
partner.bybit.com/b/56404
partner.bybit.com/b/56404
면책사항
해당 정보와 게시물은 금융, 투자, 트레이딩 또는 기타 유형의 조언이나 권장 사항으로 간주되지 않으며, 트레이딩뷰에서 제공하거나 보증하는 것이 아닙니다. 자세한 내용은 이용 약관을 참조하세요.
bybit sign up:
partner.bybit.com/b/56404
partner.bybit.com/b/56404
면책사항
해당 정보와 게시물은 금융, 투자, 트레이딩 또는 기타 유형의 조언이나 권장 사항으로 간주되지 않으며, 트레이딩뷰에서 제공하거나 보증하는 것이 아닙니다. 자세한 내용은 이용 약관을 참조하세요.