
Hello Traders!
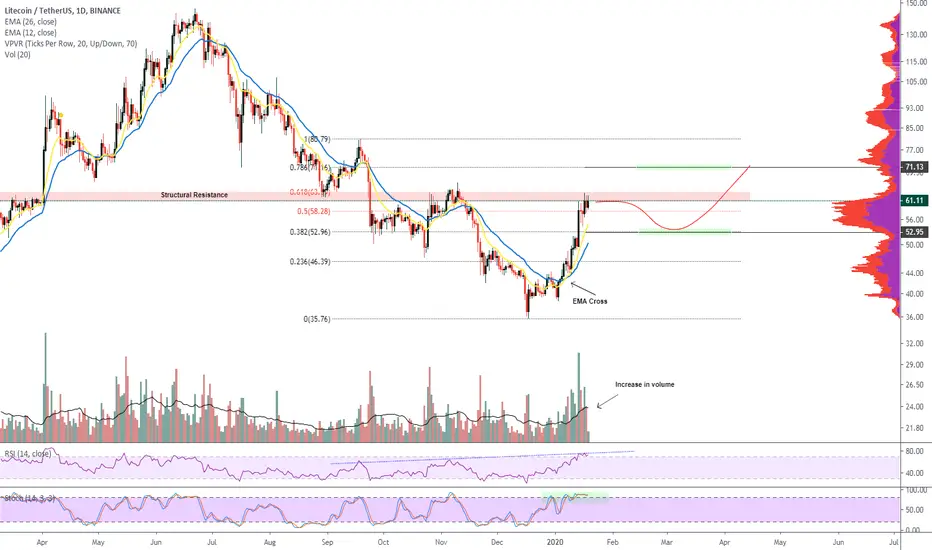
Today’s chart update will be on LTCUSDT where a key structural level is being tested, a break will confirm a trend change.
Points to consider,
- Higher high probable
- Structural resistance in confluence with .236 Fibonacci
- EMA’s cross bullish
- RSI trading in overbought
- Stochastics in upper regions
- Volume increasing
LTCUSDT has a higher high projection which will negate the bearish structure of lower lows. Resistance which is in confluence with the .236 Fibonacci is a strong level for bulls to break to confirm the structural change.
EMA’s have crossed bullish, needs to hold LTC support when key levels are broken to maintain a bullish bias.
RSI is currently overbought; hitting its resistance, a return to neutral territory is quite probable. The stochastics is currently trading in the upper regions, can stay here for an extended period of time, however lots of stored momentum to the downside.
Volume has increase, healthy for LTC’s trend change, this needs to sustain for follow through otherwise a fake out will be imminent.
Overall, in my opinion, LTCUSDT trend change will come to fruition when key structural resistance is broken with a close above. We need to see convincing bull volume which will help with follow though.
What are your thoughts?
Please leave a like and comment,
And remember,
“Win, loss whatever emerges in the short-term, place and manage your next trades untouched, unattached... always keeping your eyes on the long-term picture.”
― Yvan Byeajee
Today’s chart update will be on LTCUSDT where a key structural level is being tested, a break will confirm a trend change.
Points to consider,
- Higher high probable
- Structural resistance in confluence with .236 Fibonacci
- EMA’s cross bullish
- RSI trading in overbought
- Stochastics in upper regions
- Volume increasing
LTCUSDT has a higher high projection which will negate the bearish structure of lower lows. Resistance which is in confluence with the .236 Fibonacci is a strong level for bulls to break to confirm the structural change.
EMA’s have crossed bullish, needs to hold LTC support when key levels are broken to maintain a bullish bias.
RSI is currently overbought; hitting its resistance, a return to neutral territory is quite probable. The stochastics is currently trading in the upper regions, can stay here for an extended period of time, however lots of stored momentum to the downside.
Volume has increase, healthy for LTC’s trend change, this needs to sustain for follow through otherwise a fake out will be imminent.
Overall, in my opinion, LTCUSDT trend change will come to fruition when key structural resistance is broken with a close above. We need to see convincing bull volume which will help with follow though.
What are your thoughts?
Please leave a like and comment,
And remember,
“Win, loss whatever emerges in the short-term, place and manage your next trades untouched, unattached... always keeping your eyes on the long-term picture.”
― Yvan Byeajee

Join the Free Trading Group
Telegram: t.me/freetradingden 🔥
Claim $1000 Deposit Bonus 🎁
Trade with perks & support the community!
partner.blofin.com/d/TheAlchemist
Stay sharp, trade smart.
— Team The Alchemist ⚔️
Telegram: t.me/freetradingden 🔥
Claim $1000 Deposit Bonus 🎁
Trade with perks & support the community!
partner.blofin.com/d/TheAlchemist
Stay sharp, trade smart.
— Team The Alchemist ⚔️
면책사항
해당 정보와 게시물은 금융, 투자, 트레이딩 또는 기타 유형의 조언이나 권장 사항으로 간주되지 않으며, 트레이딩뷰에서 제공하거나 보증하는 것이 아닙니다. 자세한 내용은 이용 약관을 참조하세요.
Join the Free Trading Group
Telegram: t.me/freetradingden 🔥
Claim $1000 Deposit Bonus 🎁
Trade with perks & support the community!
partner.blofin.com/d/TheAlchemist
Stay sharp, trade smart.
— Team The Alchemist ⚔️
Telegram: t.me/freetradingden 🔥
Claim $1000 Deposit Bonus 🎁
Trade with perks & support the community!
partner.blofin.com/d/TheAlchemist
Stay sharp, trade smart.
— Team The Alchemist ⚔️
면책사항
해당 정보와 게시물은 금융, 투자, 트레이딩 또는 기타 유형의 조언이나 권장 사항으로 간주되지 않으며, 트레이딩뷰에서 제공하거나 보증하는 것이 아닙니다. 자세한 내용은 이용 약관을 참조하세요.