
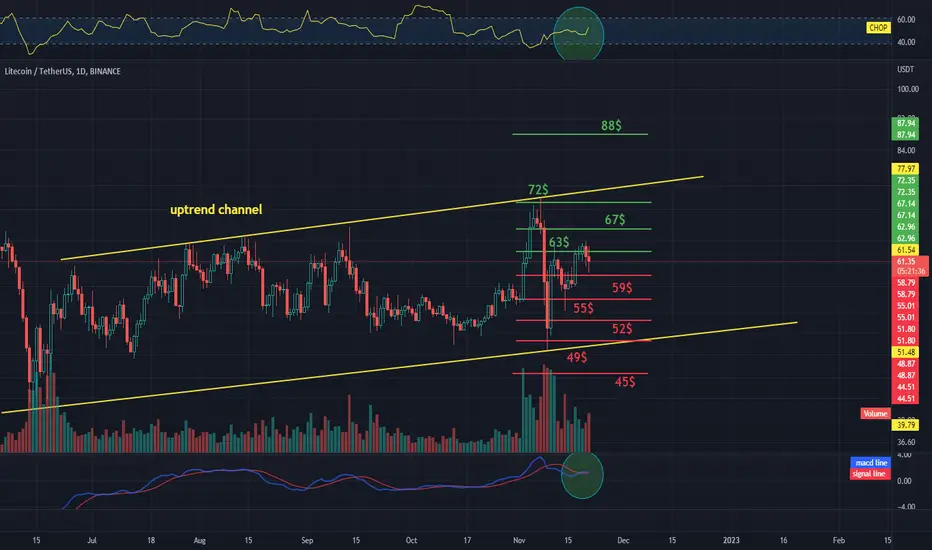
Hello everyone, I invite you to review the LTCUSDT chart, taking into account the one-day interval, we can see that the price does not record large drops despite the low stability of BTC. The yellow lines mark the uptrend channel.
Looking at the support levels, we can define several levels, first we can define support at $59, then $55, $52, $49, and $45.
Looking the other way, we see first resistance at $63, second at $67, third at $72, and fourth at $88.
Please pay attention to the CHOP index, which indicates that we are gaining more and more energy, the MACD indicator indicates an uptrend, but the volume, although not large, indicates the advantage of sellers.
Looking at the support levels, we can define several levels, first we can define support at $59, then $55, $52, $49, and $45.
Looking the other way, we see first resistance at $63, second at $67, third at $72, and fourth at $88.
Please pay attention to the CHOP index, which indicates that we are gaining more and more energy, the MACD indicator indicates an uptrend, but the volume, although not large, indicates the advantage of sellers.

면책사항
해당 정보와 게시물은 금융, 투자, 트레이딩 또는 기타 유형의 조언이나 권장 사항으로 간주되지 않으며, 트레이딩뷰에서 제공하거나 보증하는 것이 아닙니다. 자세한 내용은 이용 약관을 참조하세요.
면책사항
해당 정보와 게시물은 금융, 투자, 트레이딩 또는 기타 유형의 조언이나 권장 사항으로 간주되지 않으며, 트레이딩뷰에서 제공하거나 보증하는 것이 아닙니다. 자세한 내용은 이용 약관을 참조하세요.