
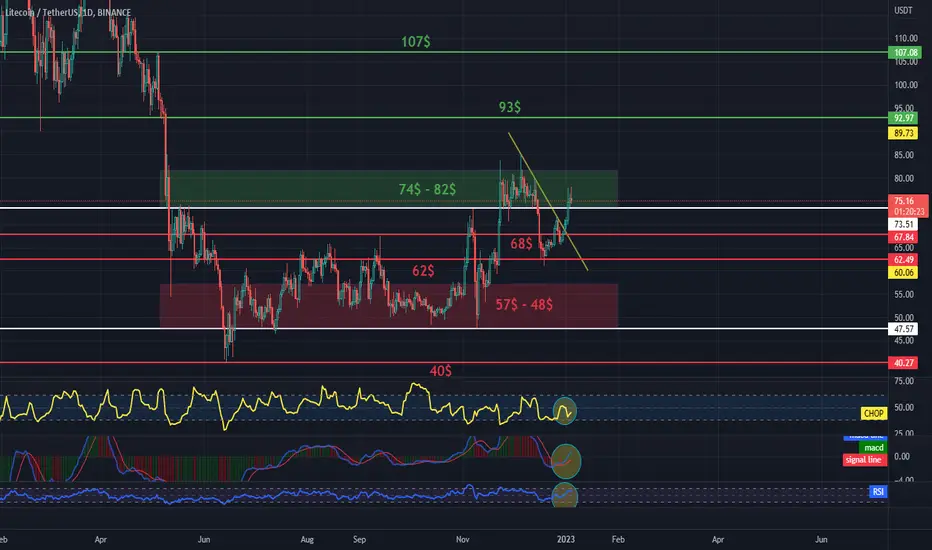
I invite you to review the LTC to USDT chart on a one-day timeframe. We will start by marking the sideways trend channel and then we can mark the local downtrend line.
Now, with the help of Fib Retracement, we will check the resistance places for the price, and here we see that we first have a strong resistance zone from $74 to $82, when we manage to break it and test it positively, we have another resistance at $93 and $107.
Looking the other way, we can mark the support areas, as you can see we have the first support at $68, the second at $62, then we can mark a strong support zone from $57 to $48, however, if it is broken and the price drops below the lower limit of the channel, we have another support at $40, which is my last low.
As we can see on the CHOP index, the energy has been used for the last move, the MACD confirms the downtrend, while the RSI touched the upper range, which means that we can expect a price correction.
Now, with the help of Fib Retracement, we will check the resistance places for the price, and here we see that we first have a strong resistance zone from $74 to $82, when we manage to break it and test it positively, we have another resistance at $93 and $107.
Looking the other way, we can mark the support areas, as you can see we have the first support at $68, the second at $62, then we can mark a strong support zone from $57 to $48, however, if it is broken and the price drops below the lower limit of the channel, we have another support at $40, which is my last low.
As we can see on the CHOP index, the energy has been used for the last move, the MACD confirms the downtrend, while the RSI touched the upper range, which means that we can expect a price correction.

면책사항
해당 정보와 게시물은 금융, 투자, 트레이딩 또는 기타 유형의 조언이나 권장 사항으로 간주되지 않으며, 트레이딩뷰에서 제공하거나 보증하는 것이 아닙니다. 자세한 내용은 이용 약관을 참조하세요.
면책사항
해당 정보와 게시물은 금융, 투자, 트레이딩 또는 기타 유형의 조언이나 권장 사항으로 간주되지 않으며, 트레이딩뷰에서 제공하거나 보증하는 것이 아닙니다. 자세한 내용은 이용 약관을 참조하세요.