롱
LTO Bullish
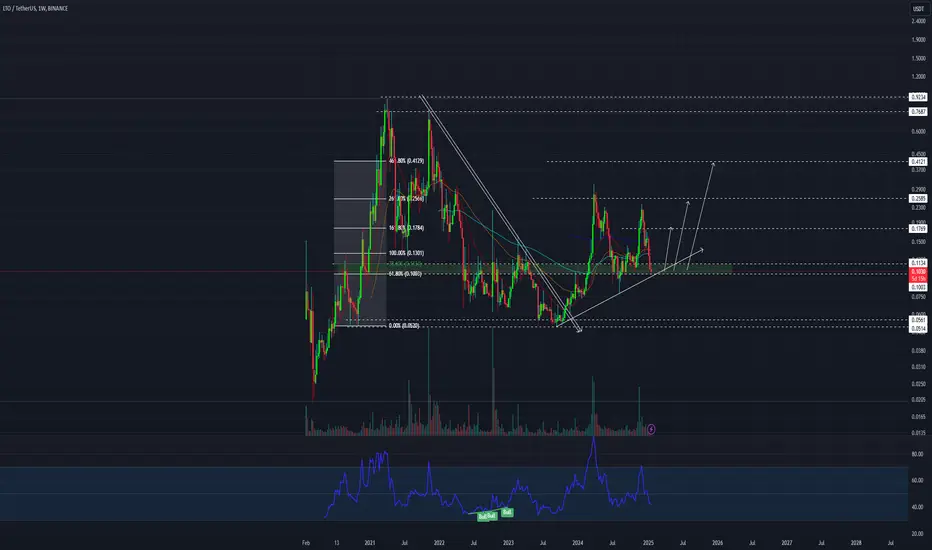
LTO-USDT is showing strong bullish signals, supported by several key technical indicators. The price has successfully retested the weekly resistance level, coinciding with the 61.8% Fibo
which is a critical area for confirming bullish momentum.
This retest was accompanied by a significantly high trading volume compared to the previous period, similar to the volume spikes observed during previous breakout waves, indicating strong Zone.
Additionally, LTO-USDT has breached a major downtrend line, further solidifying the bullish reversal.
On the 4-hour chart, a falling wedge pattern has been identified, which is typically a bullish continuation pattern. This combination of factors—retesting key resistance, high volume, breakout of a downtrend, and a falling wedge—suggests a strong potential for upward movement in LTO-USDT.

면책사항
해당 정보와 게시물은 금융, 투자, 트레이딩 또는 기타 유형의 조언이나 권장 사항으로 간주되지 않으며, 트레이딩뷰에서 제공하거나 보증하는 것이 아닙니다. 자세한 내용은 이용 약관을 참조하세요.
면책사항
해당 정보와 게시물은 금융, 투자, 트레이딩 또는 기타 유형의 조언이나 권장 사항으로 간주되지 않으며, 트레이딩뷰에서 제공하거나 보증하는 것이 아닙니다. 자세한 내용은 이용 약관을 참조하세요.