
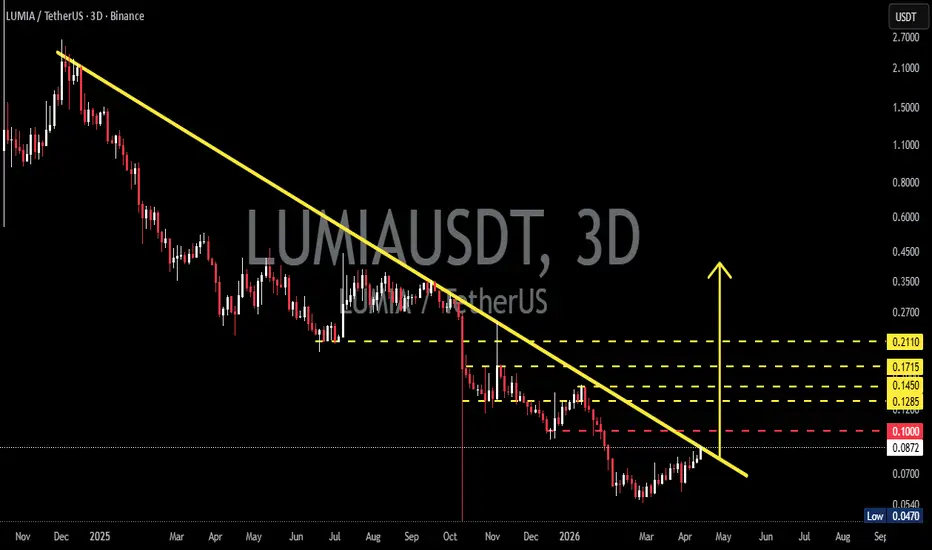
On the 3D timeframe, LUMIA/USDT is still within a strong downtrend structure, characterized by:
Consistent Lower Highs & Lower Lows
A descending trendline (yellow) acting as dynamic resistance
A sharp drop in October reinforcing bearish pressure
However, the current price action shows:
Price approaching the end of the trendline
Signs of a potential breakout
Formation of a base around the lower zone (0.05 – 0.08)
---
Structure & Patterns Identified
1. Descending Triangle / Falling Resistance
The yellow trendline represents descending resistance
Price has been consistently rejected from above
Typically a bearish continuation pattern, but can become an early reversal signal if a strong breakout occurs
2. Base Accumulation (Potential Bottoming)
After a sharp decline, price is moving sideways
Forming a strong support zone at the lows (0.047 – 0.06)
This may indicate accumulation by smart money
3. Breakout Setup
Price is currently testing the descending trendline
A breakout would confirm a potential market structure shift
---
Key Levels
Strong support: 0.047 – 0.060
Current demand zone: 0.070 – 0.090
Nearest resistance: 0.100
Next resistance / targets:
0.1285
0.1450
0.1715
0.2110
---
Bullish Scenario 🚀
Bullish confirmation occurs if:
1. Price breaks and closes above the descending trendline
2. Successfully breaks 0.100 resistance
3. Holds above it during a retest
Upside targets:
0.1285 (TP1)
0.1450 (TP2)
0.1715 (TP3)
0.2110 (TP4)
💡 This would indicate:
A shift from downtrend → uptrend
Potential mid-term reversal
---
Bearish Scenario 📉
Bearish momentum remains dominant if:
1. Price fails to break the trendline
2. Strong rejection occurs around 0.09 – 0.10
3. Price breaks back below 0.070
Downside targets:
0.060
0.047 (previous low)
💡 This suggests:
Downtrend remains intact
The breakout attempt is a fakeout / liquidity grab
---
Conclusion
LUMIA/USDT is at a critical decision zone — between:
Continuation of the downtrend
or
The beginning of a major reversal
The next move depends heavily on: 👉 Price reaction to the trendline and the 0.100 level
#LUMIAUSDT #CryptoAnalysis #TechnicalAnalysis #Altcoin #BreakoutSetup #TrendlineBreak #CryptoTrading #BullishScenario #BearishScenario #SmartMoney #Altcoins #MarketStructure
Consistent Lower Highs & Lower Lows
A descending trendline (yellow) acting as dynamic resistance
A sharp drop in October reinforcing bearish pressure
However, the current price action shows:
Price approaching the end of the trendline
Signs of a potential breakout
Formation of a base around the lower zone (0.05 – 0.08)
---
Structure & Patterns Identified
1. Descending Triangle / Falling Resistance
The yellow trendline represents descending resistance
Price has been consistently rejected from above
Typically a bearish continuation pattern, but can become an early reversal signal if a strong breakout occurs
2. Base Accumulation (Potential Bottoming)
After a sharp decline, price is moving sideways
Forming a strong support zone at the lows (0.047 – 0.06)
This may indicate accumulation by smart money
3. Breakout Setup
Price is currently testing the descending trendline
A breakout would confirm a potential market structure shift
---
Key Levels
Strong support: 0.047 – 0.060
Current demand zone: 0.070 – 0.090
Nearest resistance: 0.100
Next resistance / targets:
0.1285
0.1450
0.1715
0.2110
---
Bullish Scenario 🚀
Bullish confirmation occurs if:
1. Price breaks and closes above the descending trendline
2. Successfully breaks 0.100 resistance
3. Holds above it during a retest
Upside targets:
0.1285 (TP1)
0.1450 (TP2)
0.1715 (TP3)
0.2110 (TP4)
💡 This would indicate:
A shift from downtrend → uptrend
Potential mid-term reversal
---
Bearish Scenario 📉
Bearish momentum remains dominant if:
1. Price fails to break the trendline
2. Strong rejection occurs around 0.09 – 0.10
3. Price breaks back below 0.070
Downside targets:
0.060
0.047 (previous low)
💡 This suggests:
Downtrend remains intact
The breakout attempt is a fakeout / liquidity grab
---
Conclusion
LUMIA/USDT is at a critical decision zone — between:
Continuation of the downtrend
or
The beginning of a major reversal
The next move depends heavily on: 👉 Price reaction to the trendline and the 0.100 level
#LUMIAUSDT #CryptoAnalysis #TechnicalAnalysis #Altcoin #BreakoutSetup #TrendlineBreak #CryptoTrading #BullishScenario #BearishScenario #SmartMoney #Altcoins #MarketStructure

✅ Get Free Signals! Join Our Telegram Channel Here: t.me/TheCryptoNuclear
✅ Twitter: twitter.com/crypto_nuclear
✅ Join Bybit : partner.bybit.com/b/nuclearvip
✅ Benefits : Lifetime Trading Fee Discount -50%
✅ Twitter: twitter.com/crypto_nuclear
✅ Join Bybit : partner.bybit.com/b/nuclearvip
✅ Benefits : Lifetime Trading Fee Discount -50%
면책사항
해당 정보와 게시물은 금융, 투자, 트레이딩 또는 기타 유형의 조언이나 권장 사항으로 간주되지 않으며, 트레이딩뷰에서 제공하거나 보증하는 것이 아닙니다. 자세한 내용은 이용 약관을 참조하세요.
✅ Get Free Signals! Join Our Telegram Channel Here: t.me/TheCryptoNuclear
✅ Twitter: twitter.com/crypto_nuclear
✅ Join Bybit : partner.bybit.com/b/nuclearvip
✅ Benefits : Lifetime Trading Fee Discount -50%
✅ Twitter: twitter.com/crypto_nuclear
✅ Join Bybit : partner.bybit.com/b/nuclearvip
✅ Benefits : Lifetime Trading Fee Discount -50%
면책사항
해당 정보와 게시물은 금융, 투자, 트레이딩 또는 기타 유형의 조언이나 권장 사항으로 간주되지 않으며, 트레이딩뷰에서 제공하거나 보증하는 것이 아닙니다. 자세한 내용은 이용 약관을 참조하세요.