
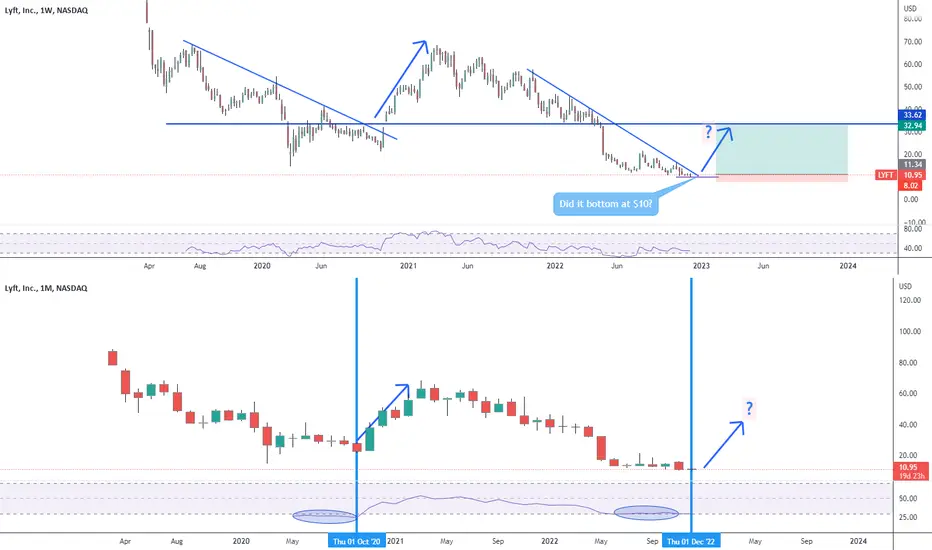
Top chart weekly, bottom chart monthly. See the pattern? The monthly timeframe shows the price has been trading in oversold territory for 5 months, last time that happened the price blew up. I'm opening a small long position on Monday if a see the price trying to break the resistance I'll add.
액티브 트레이드
Just added. The $11.50 support level is holding well액티브 트레이드
Well, the $10 is holding well. Still holding my long position. Looks like bulls are coming back.
면책사항
해당 정보와 게시물은 금융, 투자, 트레이딩 또는 기타 유형의 조언이나 권장 사항으로 간주되지 않으며, 트레이딩뷰에서 제공하거나 보증하는 것이 아닙니다. 자세한 내용은 이용 약관을 참조하세요.
면책사항
해당 정보와 게시물은 금융, 투자, 트레이딩 또는 기타 유형의 조언이나 권장 사항으로 간주되지 않으며, 트레이딩뷰에서 제공하거나 보증하는 것이 아닙니다. 자세한 내용은 이용 약관을 참조하세요.