
This chart and analysis are not financial advice. Do your own research before trading or investing.
Disclaimer: This is just an idea, not financial advice.
Here's why some people might be interested in MARA.N:
Trading activity is high: There were a lot of shares traded recently, which can signal interest from investors.
Industry is hot: Tourism is picking up, and hotel stocks might benefit.
Why some investors might be bullish on MARA.N (optimistic about the price going up):
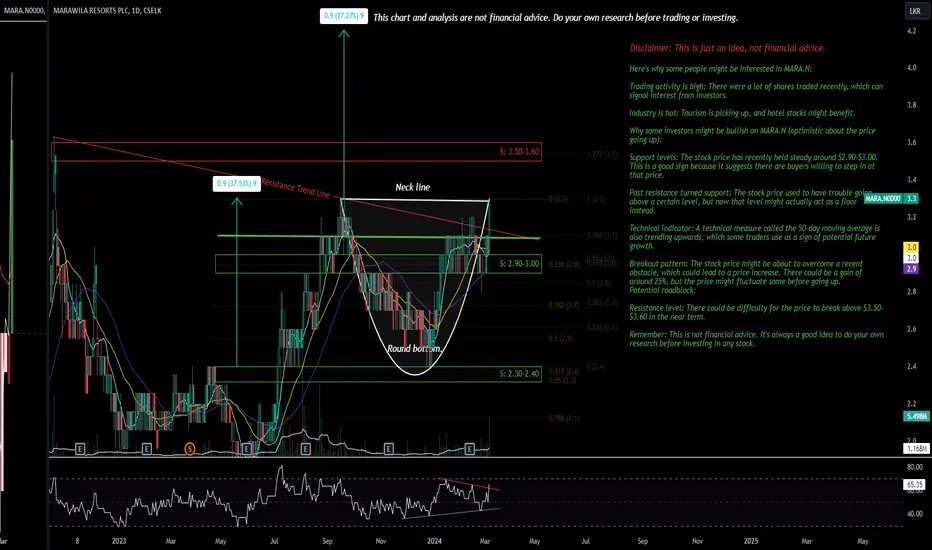
Support levels: The stock price has recently held steady around $2.90-$3.00. This is a good sign because it suggests there are buyers willing to step in at that price.
Past resistance turned support: The stock price used to have trouble going above a certain level, but now that level might actually act as a floor instead.
Technical indicator: A technical measure called the 50-day moving average is also trending upwards, which some traders use as a sign of potential future growth.
Breakout pattern: The stock price might be about to overcome a recent obstacle, which could lead to a price increase. There could be a gain of around 25%, but the price might fluctuate some before going up.
Potential roadblock:
Resistance level: There could be difficulty for the price to break above $3.50-$3.60 in the near term.
Remember: This is not financial advice. It's always a good idea to do your own research before investing in any stock.
Disclaimer: This is just an idea, not financial advice.
Here's why some people might be interested in MARA.N:
Trading activity is high: There were a lot of shares traded recently, which can signal interest from investors.
Industry is hot: Tourism is picking up, and hotel stocks might benefit.
Why some investors might be bullish on MARA.N (optimistic about the price going up):
Support levels: The stock price has recently held steady around $2.90-$3.00. This is a good sign because it suggests there are buyers willing to step in at that price.
Past resistance turned support: The stock price used to have trouble going above a certain level, but now that level might actually act as a floor instead.
Technical indicator: A technical measure called the 50-day moving average is also trending upwards, which some traders use as a sign of potential future growth.
Breakout pattern: The stock price might be about to overcome a recent obstacle, which could lead to a price increase. There could be a gain of around 25%, but the price might fluctuate some before going up.
Potential roadblock:
Resistance level: There could be difficulty for the price to break above $3.50-$3.60 in the near term.
Remember: This is not financial advice. It's always a good idea to do your own research before investing in any stock.

면책사항
해당 정보와 게시물은 금융, 투자, 트레이딩 또는 기타 유형의 조언이나 권장 사항으로 간주되지 않으며, 트레이딩뷰에서 제공하거나 보증하는 것이 아닙니다. 자세한 내용은 이용 약관을 참조하세요.
면책사항
해당 정보와 게시물은 금융, 투자, 트레이딩 또는 기타 유형의 조언이나 권장 사항으로 간주되지 않으며, 트레이딩뷰에서 제공하거나 보증하는 것이 아닙니다. 자세한 내용은 이용 약관을 참조하세요.