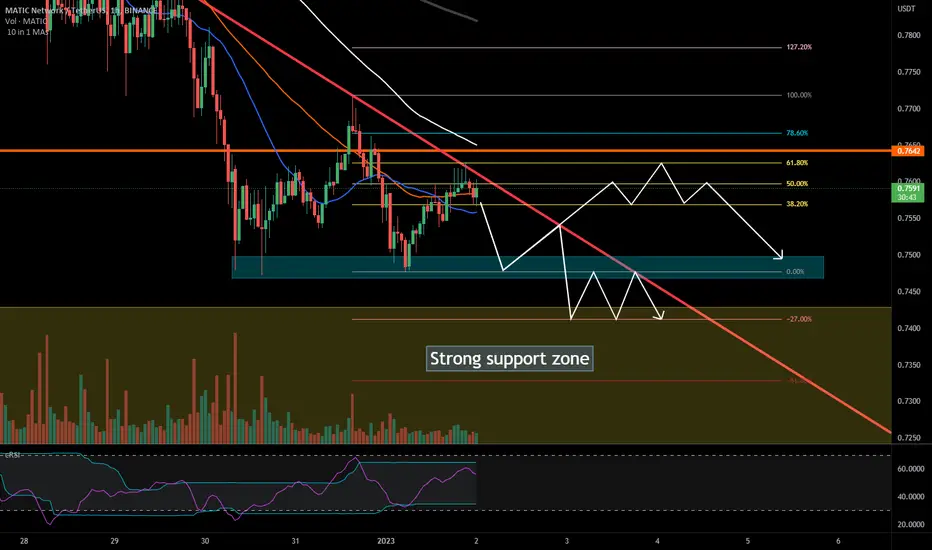
2 possible MATIC trajectories
$BINANCE:MATICUSDT
The price is near a very strong support zone . If the price bounces once again against the red trendline as shown on the chart, it is most likely to fall to the support zone drawn approximately to the -27% Fibonacci level. If the trendline is not respected and a strong bullish candle closes above the red trendline, it is most likely that the price will rise to the 61.8% Fibonacci level, coinciding approximately with a previous high.
The price is near a very strong support zone . If the price bounces once again against the red trendline as shown on the chart, it is most likely to fall to the support zone drawn approximately to the -27% Fibonacci level. If the trendline is not respected and a strong bullish candle closes above the red trendline, it is most likely that the price will rise to the 61.8% Fibonacci level, coinciding approximately with a previous high.

면책사항
해당 정보와 게시물은 금융, 투자, 트레이딩 또는 기타 유형의 조언이나 권장 사항으로 간주되지 않으며, 트레이딩뷰에서 제공하거나 보증하는 것이 아닙니다. 자세한 내용은 이용 약관을 참조하세요.
면책사항
해당 정보와 게시물은 금융, 투자, 트레이딩 또는 기타 유형의 조언이나 권장 사항으로 간주되지 않으며, 트레이딩뷰에서 제공하거나 보증하는 것이 아닙니다. 자세한 내용은 이용 약관을 참조하세요.