롱
MATICUSDT
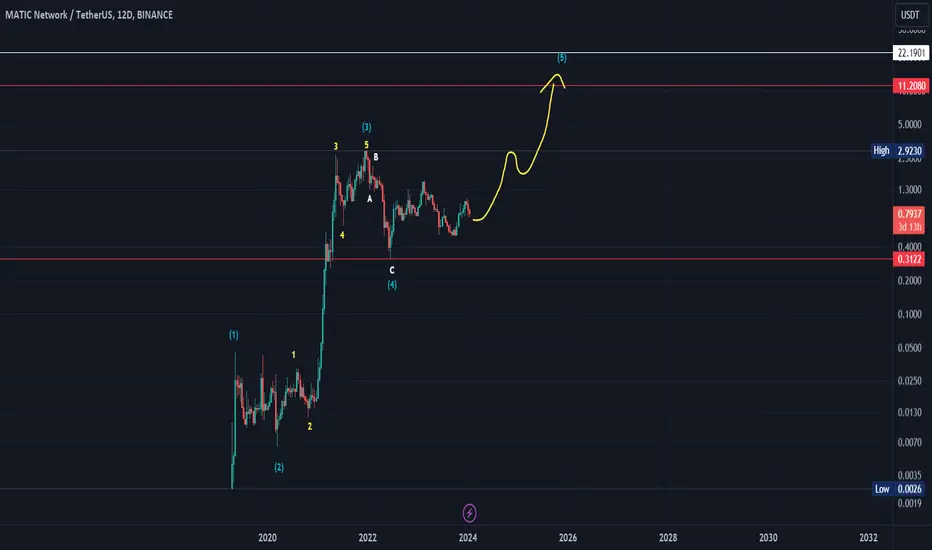
From the data shown on the chart, we find that as long as the currency does not break the bottom of the area 0.5 usdt , this indicates the accumulation of a new wave of payment, in addition to the fact that the currency against Bitcoin has been going sideways for 31 monthly candles, and this indicates the upcoming stages of accumulation and a calming of the previous indicators of inflation.
All data on the chart.. Good luck
All data on the chart.. Good luck
주문취소됨

면책사항
해당 정보와 게시물은 금융, 투자, 트레이딩 또는 기타 유형의 조언이나 권장 사항으로 간주되지 않으며, 트레이딩뷰에서 제공하거나 보증하는 것이 아닙니다. 자세한 내용은 이용 약관을 참조하세요.
면책사항
해당 정보와 게시물은 금융, 투자, 트레이딩 또는 기타 유형의 조언이나 권장 사항으로 간주되지 않으며, 트레이딩뷰에서 제공하거나 보증하는 것이 아닙니다. 자세한 내용은 이용 약관을 참조하세요.