MATICUSDT market structure
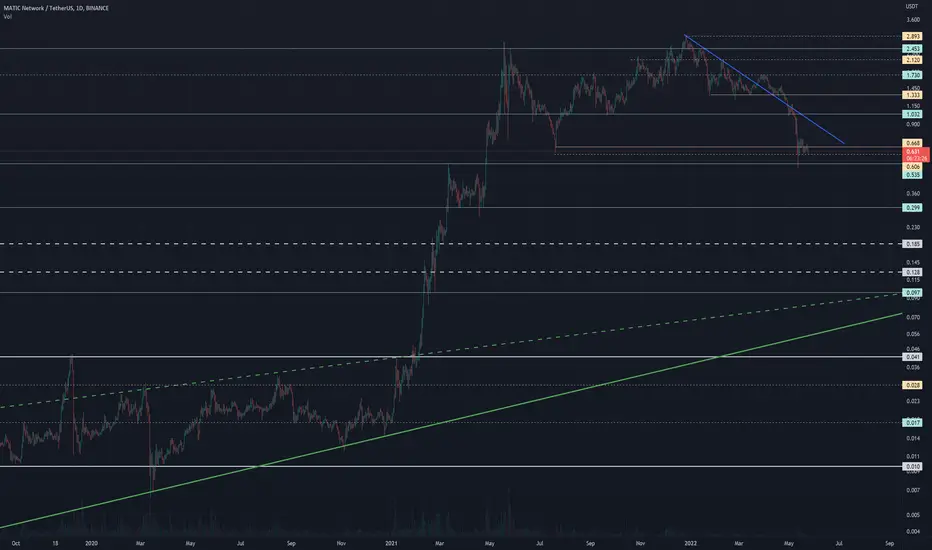
Strong levels represented by solid lines.
Less significant levels represented by dashed lines.
Trendlines represented by slanted lines.
More often than not, price action is choppy with much overlap between candles. Strictly following definitions for swing high/low could leave us with a market structure that is just unworkable. Our intent is simply to identify those key turning points which stand out on the chart as the most obvious levels, and therefore offer potential barriers to future price action.

면책사항
해당 정보와 게시물은 금융, 투자, 트레이딩 또는 기타 유형의 조언이나 권장 사항으로 간주되지 않으며, 트레이딩뷰에서 제공하거나 보증하는 것이 아닙니다. 자세한 내용은 이용 약관을 참조하세요.
면책사항
해당 정보와 게시물은 금융, 투자, 트레이딩 또는 기타 유형의 조언이나 권장 사항으로 간주되지 않으며, 트레이딩뷰에서 제공하거나 보증하는 것이 아닙니다. 자세한 내용은 이용 약관을 참조하세요.