#MATIC HTF super bearish
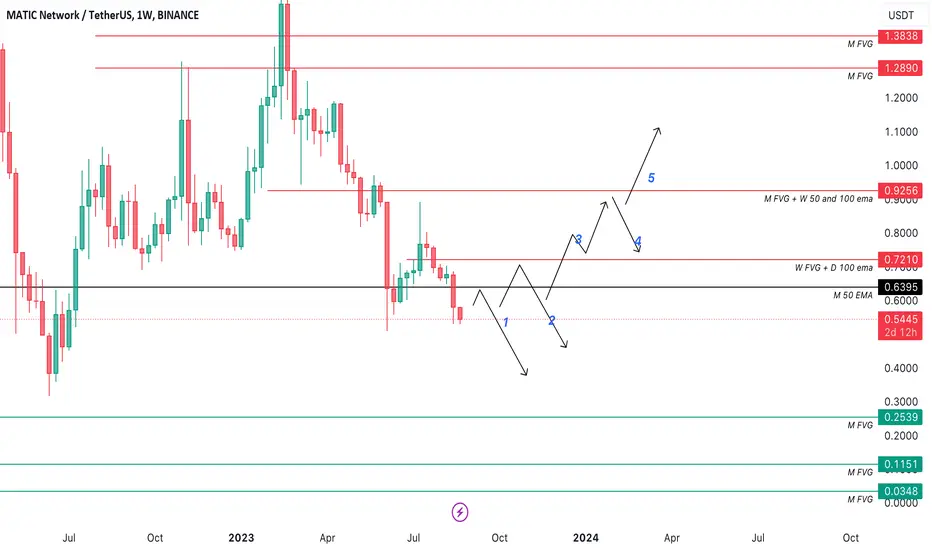
In this chart I tried to predict all possible scenarios and highlighted the most strong resistance (red lines) and support (green lines) levels.
Since I am trying to make understanding my TA easier. I marked every possible move of the coin with numbers.
Now let me explain every number:
1. Matic bounces until Monthly 50 ema support at the level 0.63$ and from that level we get bear reaction. It can be long wicks above the candle or bearish divergence on LTF. In this case the probability to see downward move towards to 0.25$ increases
2. The coin goes higher to 0.72$ where it faces with W FVG and D 100 ema resistance - we see bears reaction in this case price comes back to 0.63$ and below.
3. Coin breaks through 0.72$ resistance, retests that level ( because it becomes a support) and in this case the continuation of the uptrend increases and we may see the coin around 0.92$
4. The coin faces 0.92$ where there is M FVG + Weekly 50 and 100 ema resistance. We see bears reaction in this case Matic welcome back to 0.72$
5. The coin breaks through 0.92$, would be nice to see the retest of that level, in this case the coin go higher to 1.1$ and etc
Since I am trying to make understanding my TA easier. I marked every possible move of the coin with numbers.
Now let me explain every number:
1. Matic bounces until Monthly 50 ema support at the level 0.63$ and from that level we get bear reaction. It can be long wicks above the candle or bearish divergence on LTF. In this case the probability to see downward move towards to 0.25$ increases
2. The coin goes higher to 0.72$ where it faces with W FVG and D 100 ema resistance - we see bears reaction in this case price comes back to 0.63$ and below.
3. Coin breaks through 0.72$ resistance, retests that level ( because it becomes a support) and in this case the continuation of the uptrend increases and we may see the coin around 0.92$
4. The coin faces 0.92$ where there is M FVG + Weekly 50 and 100 ema resistance. We see bears reaction in this case Matic welcome back to 0.72$
5. The coin breaks through 0.92$, would be nice to see the retest of that level, in this case the coin go higher to 1.1$ and etc

면책사항
해당 정보와 게시물은 금융, 투자, 트레이딩 또는 기타 유형의 조언이나 권장 사항으로 간주되지 않으며, 트레이딩뷰에서 제공하거나 보증하는 것이 아닙니다. 자세한 내용은 이용 약관을 참조하세요.
면책사항
해당 정보와 게시물은 금융, 투자, 트레이딩 또는 기타 유형의 조언이나 권장 사항으로 간주되지 않으며, 트레이딩뷰에서 제공하거나 보증하는 것이 아닙니다. 자세한 내용은 이용 약관을 참조하세요.