숏
MATIC Bearish Chart Pattern
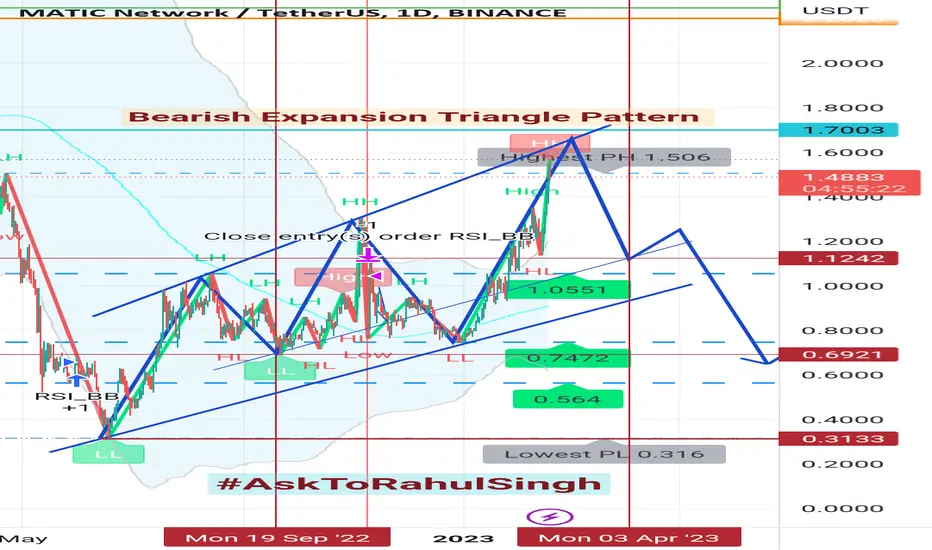
MATIC/USDT 1 DAY Chart
As per present #MATIC Technical Chart Analysis, based on Bearish Expansion Triangle Pattern, its 3rd final wave nearly completed today now and it's downside last wave will be starts. It's coming next target will be $1.13 and after next #BearishZone starts, next Lower-Low target is $0.69 upto April 2023.
As per present #MATIC Technical Chart Analysis, based on Bearish Expansion Triangle Pattern, its 3rd final wave nearly completed today now and it's downside last wave will be starts. It's coming next target will be $1.13 and after next #BearishZone starts, next Lower-Low target is $0.69 upto April 2023.

관련 발행물
면책사항
해당 정보와 게시물은 금융, 투자, 트레이딩 또는 기타 유형의 조언이나 권장 사항으로 간주되지 않으며, 트레이딩뷰에서 제공하거나 보증하는 것이 아닙니다. 자세한 내용은 이용 약관을 참조하세요.
관련 발행물
면책사항
해당 정보와 게시물은 금융, 투자, 트레이딩 또는 기타 유형의 조언이나 권장 사항으로 간주되지 않으며, 트레이딩뷰에서 제공하거나 보증하는 것이 아닙니다. 자세한 내용은 이용 약관을 참조하세요.