롱
#Matic 1W chart;
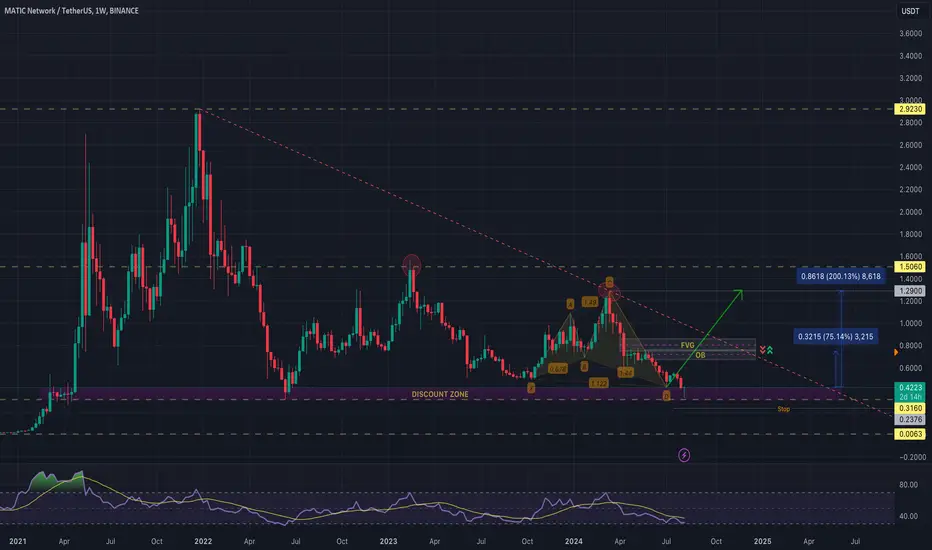
$CRYPTOCAP:MATIC 1W chart;
On the weekly chart, we can see that the balance of February 2023 and March 2024 levels on the RSI side is not reflected in the price (red circles).
It is now at a serious support level and it also seems to have started a bullish pattern from these levels.
As long as it sticks to the stop level, it will not be a surprise to see sharp upward rises after the squeeze between it and the downtrend line it will enter.
The ratio between the pattern target level is 200
However, we can consider OB-FVG regions as a profit-taking level beforehand.
On the weekly chart, we can see that the balance of February 2023 and March 2024 levels on the RSI side is not reflected in the price (red circles).
It is now at a serious support level and it also seems to have started a bullish pattern from these levels.
As long as it sticks to the stop level, it will not be a surprise to see sharp upward rises after the squeeze between it and the downtrend line it will enter.
The ratio between the pattern target level is 200
However, we can consider OB-FVG regions as a profit-taking level beforehand.

For more you can follow me on X. @UgurTash
면책사항
해당 정보와 게시물은 금융, 투자, 트레이딩 또는 기타 유형의 조언이나 권장 사항으로 간주되지 않으며, 트레이딩뷰에서 제공하거나 보증하는 것이 아닙니다. 자세한 내용은 이용 약관을 참조하세요.
For more you can follow me on X. @UgurTash
면책사항
해당 정보와 게시물은 금융, 투자, 트레이딩 또는 기타 유형의 조언이나 권장 사항으로 간주되지 않으며, 트레이딩뷰에서 제공하거나 보증하는 것이 아닙니다. 자세한 내용은 이용 약관을 참조하세요.