MATIC/USDT price movement variantes
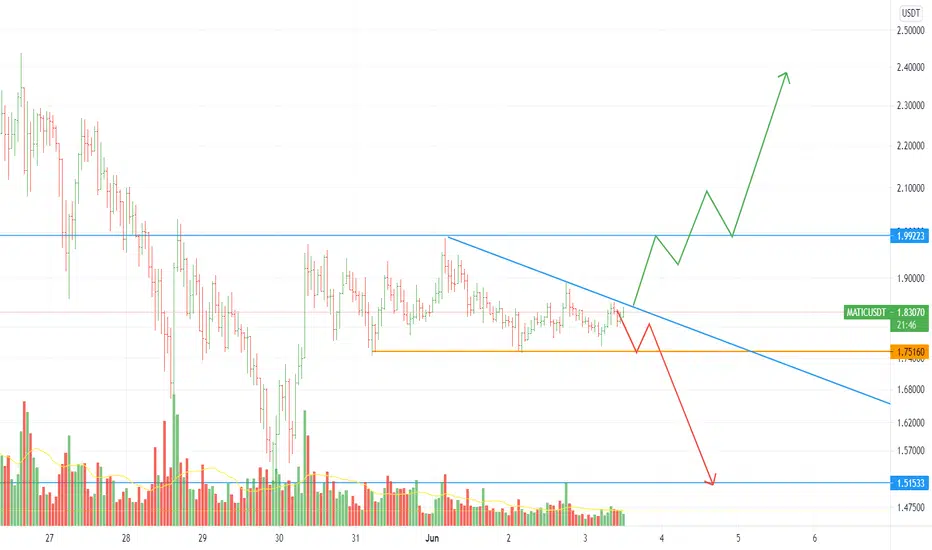
Let’s check the MATIC/USDT pair chart. Daily timeframe shows us that MATIC is trading into the narrow channel between $1.75 and $2. Moreover, we can notice that sellers try to press down the price to the $1.75 and lower. If the price closes under or above $2 it will be a strong signal to purchase MATIC in long. Besides further price movement of this pair depends on BTC. That’s why we need to follow BTC chart to make the right deal.

면책사항
해당 정보와 게시물은 금융, 투자, 트레이딩 또는 기타 유형의 조언이나 권장 사항으로 간주되지 않으며, 트레이딩뷰에서 제공하거나 보증하는 것이 아닙니다. 자세한 내용은 이용 약관을 참조하세요.
면책사항
해당 정보와 게시물은 금융, 투자, 트레이딩 또는 기타 유형의 조언이나 권장 사항으로 간주되지 않으며, 트레이딩뷰에서 제공하거나 보증하는 것이 아닙니다. 자세한 내용은 이용 약관을 참조하세요.