롱
Polygon (MATIC) Technical Indicators Point to Continuous Growth
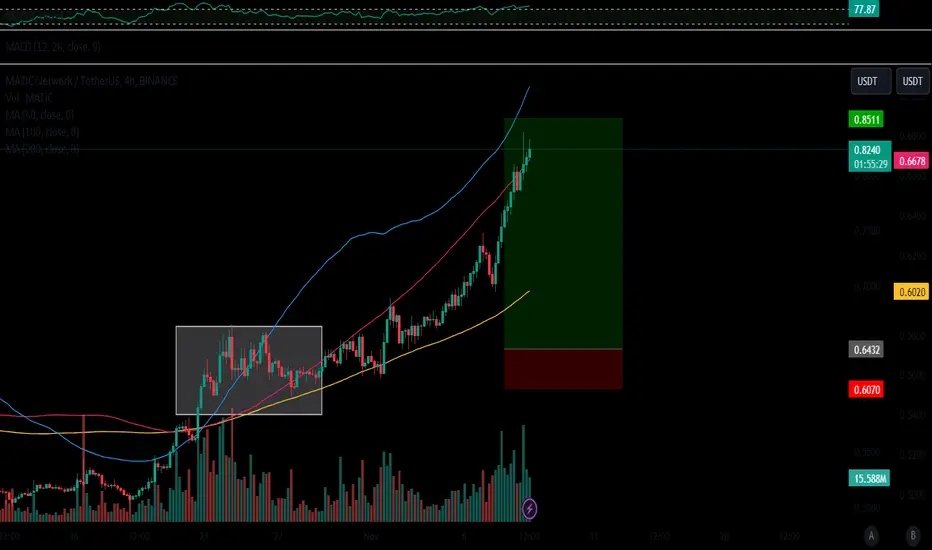
Polygon’s native token MATIC has seen impressive gains over the last week, rallying over 20% amid a resurgent crypto market. MATIC is currently trading around $0.76, up from under $0.65 just 7 days ago.
indicators like RSI and MACD were turning bullish, breaking out from previous bearish zones. There was also bullish crossover on the 9-period EMA, and MATIC printed green candles on the 1hr and 4hr timeframes. These were all signals to go long on MATIC.
Currently, MATIC’s RSI is around 53. An RSI reading in the 50-60 range indicates bullish momentum is building in an uptrend, but there is still room left before overbought conditions. This aligns nicely for further upside potential in MATIC’s price.
In summary, MATIC’s strong technical setup and bullish indicators suggest its powerful rally over the last week may have further to go. MATIC looks poised to retest overhead resistance around the $0.80 level if it can hold above key support at $0.70.

면책사항
해당 정보와 게시물은 금융, 투자, 트레이딩 또는 기타 유형의 조언이나 권장 사항으로 간주되지 않으며, 트레이딩뷰에서 제공하거나 보증하는 것이 아닙니다. 자세한 내용은 이용 약관을 참조하세요.
면책사항
해당 정보와 게시물은 금융, 투자, 트레이딩 또는 기타 유형의 조언이나 권장 사항으로 간주되지 않으며, 트레이딩뷰에서 제공하거나 보증하는 것이 아닙니다. 자세한 내용은 이용 약관을 참조하세요.