Long
BBMA : MATIC still BULLISH.
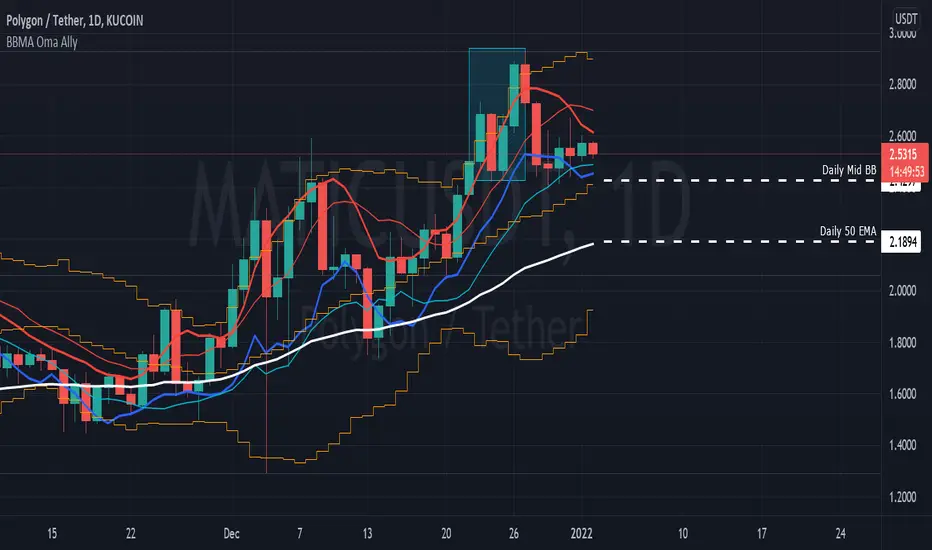
Here is my follow up on the Bearish MATIC analysis.
On this Daily Chart, there is momentum candlestick that break above the Daily Upper Band. The key is there is no Extreme Momentum shown during the break. (Which is the 5/10 High [RED] MA break the Upper Band. This tell us that the Bullish Momentum is still VALID.
You can Buy using Cost Averaging at MID BB and if the price goes down, Buy more around the 50 EMA Zone.
On this Daily Chart, there is momentum candlestick that break above the Daily Upper Band. The key is there is no Extreme Momentum shown during the break. (Which is the 5/10 High [RED] MA break the Upper Band. This tell us that the Bullish Momentum is still VALID.
You can Buy using Cost Averaging at MID BB and if the price goes down, Buy more around the 50 EMA Zone.

관련 발행물
면책사항
해당 정보와 게시물은 금융, 투자, 트레이딩 또는 기타 유형의 조언이나 권장 사항으로 간주되지 않으며, 트레이딩뷰에서 제공하거나 보증하는 것이 아닙니다. 자세한 내용은 이용 약관을 참조하세요.
면책사항
해당 정보와 게시물은 금융, 투자, 트레이딩 또는 기타 유형의 조언이나 권장 사항으로 간주되지 않으며, 트레이딩뷰에서 제공하거나 보증하는 것이 아닙니다. 자세한 내용은 이용 약관을 참조하세요.