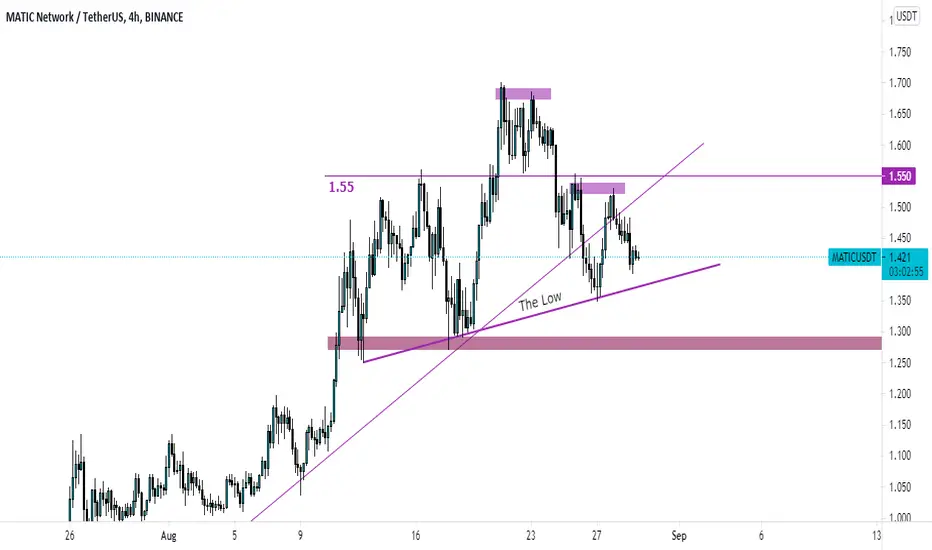
$MATIC forming Head & Shoulder pattern
After a slight rebound,
#MATIC reached its resistance zone facing the selling price.
The price seems to form an H&S (head and shoulders) pattern, which is bearish.
Well, until the price does not break below the low (marked in the chart), everything is fine.
Potentially, prices may also rebound from the small trend line.
#MATIC reached its resistance zone facing the selling price.
The price seems to form an H&S (head and shoulders) pattern, which is bearish.
Well, until the price does not break below the low (marked in the chart), everything is fine.
Potentially, prices may also rebound from the small trend line.

iSmashProfit
관련 발행물
면책사항
해당 정보와 게시물은 금융, 투자, 트레이딩 또는 기타 유형의 조언이나 권장 사항으로 간주되지 않으며, 트레이딩뷰에서 제공하거나 보증하는 것이 아닙니다. 자세한 내용은 이용 약관을 참조하세요.
iSmashProfit
관련 발행물
면책사항
해당 정보와 게시물은 금융, 투자, 트레이딩 또는 기타 유형의 조언이나 권장 사항으로 간주되지 않으며, 트레이딩뷰에서 제공하거나 보증하는 것이 아닙니다. 자세한 내용은 이용 약관을 참조하세요.