
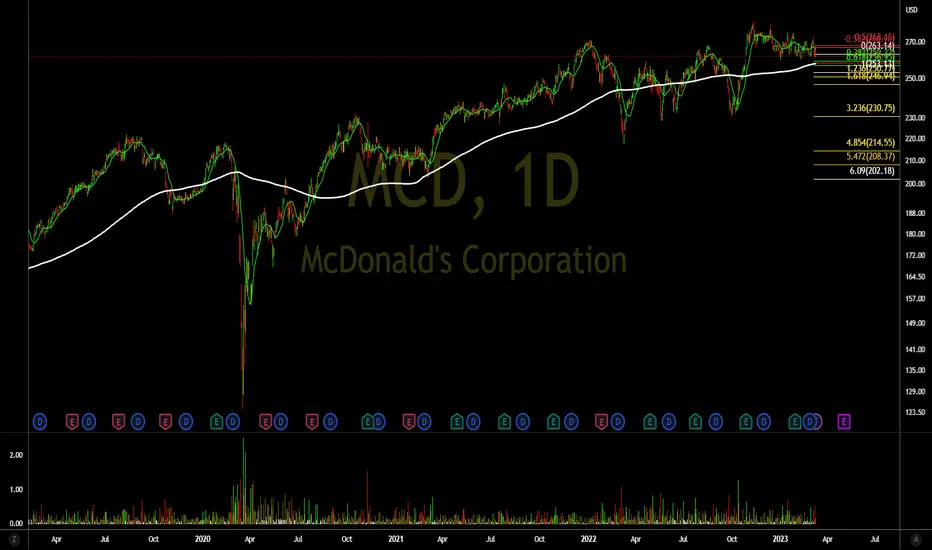
-One of the most promising companies and the largest chain of restaurants in the world (fast food), can it go through corrections?
-If the answer is yes, that means we really could have such a "recession" soon.
-Based on SETUP and graphical analysis, there are some indications that we may have sharper corrections in the asset.
-I believe that long-term investors will want more premiums to buy the asset, mostly due to high inflation and, mainly, due to the monetary tightening that the FED will introduce.
-But this is a controversial thing, after all, when there is a reduction in the purchasing power of the masses, companies like MC DONALDS manage to benefit a lot from the situation. Is this graphic analysis trying to play a trick on me?
-Using the monthly chart, it indicates that the stock is entering a downtrend. Or will it be a correction to the region of $245.37? Or do we have a flag? There are so many variables to consider!

-By the weekly chart and upward trend it lost its strength in December 2022, where it ended up forming a bearish pivot as shown in the image below. We have prices losing and gaining the critical zone of $264.23. If there is a loss in this region, the correction could be towards $241.49 at first.

-Going down a little further, on the daily chart, we have this beautiful bearish pivot almost forming, and its destination according to the SETUP used is much lower. We have the long average at 253.13. Will it be able to help hold prices?

-Honestly, I hope I'm totally wrong!
-Do your analysis and good business.
-Be Aware, If You Buy, Use Stop!
-See below for other graphic analysis!
-If the answer is yes, that means we really could have such a "recession" soon.
-Based on SETUP and graphical analysis, there are some indications that we may have sharper corrections in the asset.
-I believe that long-term investors will want more premiums to buy the asset, mostly due to high inflation and, mainly, due to the monetary tightening that the FED will introduce.
-But this is a controversial thing, after all, when there is a reduction in the purchasing power of the masses, companies like MC DONALDS manage to benefit a lot from the situation. Is this graphic analysis trying to play a trick on me?
-Using the monthly chart, it indicates that the stock is entering a downtrend. Or will it be a correction to the region of $245.37? Or do we have a flag? There are so many variables to consider!
-By the weekly chart and upward trend it lost its strength in December 2022, where it ended up forming a bearish pivot as shown in the image below. We have prices losing and gaining the critical zone of $264.23. If there is a loss in this region, the correction could be towards $241.49 at first.
-Going down a little further, on the daily chart, we have this beautiful bearish pivot almost forming, and its destination according to the SETUP used is much lower. We have the long average at 253.13. Will it be able to help hold prices?
-Honestly, I hope I'm totally wrong!
-Do your analysis and good business.
-Be Aware, If You Buy, Use Stop!
-See below for other graphic analysis!

관련 발행물
면책사항
해당 정보와 게시물은 금융, 투자, 트레이딩 또는 기타 유형의 조언이나 권장 사항으로 간주되지 않으며, 트레이딩뷰에서 제공하거나 보증하는 것이 아닙니다. 자세한 내용은 이용 약관을 참조하세요.
관련 발행물
면책사항
해당 정보와 게시물은 금융, 투자, 트레이딩 또는 기타 유형의 조언이나 권장 사항으로 간주되지 않으며, 트레이딩뷰에서 제공하거나 보증하는 것이 아닙니다. 자세한 내용은 이용 약관을 참조하세요.