
Mclean Technologies Berhad
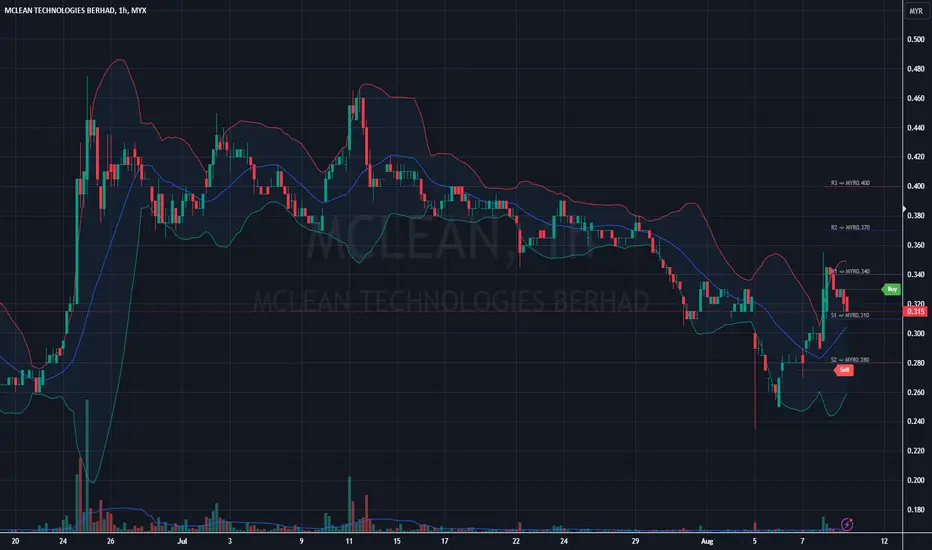
Overall, the stock appears to be in a downtrend but showing signs of potential stabilization or reversal. Traders should watch for a confirmed break above resistance or a breakdown below support for clearer directional signals.
- Trend: The overall trend appears bearish in the medium term. The price has been making lower highs and lower lows since mid-July.
- Support and Resistance:
###Key support level around 0.235-0.240 MYR
###Resistance levels at around 0.360 MYR and 0.420 MYR - Moving Averages: The stock is trading below both the short-term (likely 20-day) and long-term (likely 50-day) moving averages, indicating bearish sentiment.
- Volume: There are sporadic volume spikes, particularly noticeable in late July and early August, which could indicate increased interest or significant events.
- Price Action: The stock has shown high volatility, with sharp drops followed by quick rebounds. Most recently, there was a significant drop to the support level around 0.235 MYR, followed by a sharp rebound.
- Bollinger Bands: The price has been touching the lower Bollinger Band frequently, suggesting oversold conditions at times.
- Recent Movement: There's been a recent upward movement from the support level, but it's encountering resistance around the 0.340-0.360 MYR range.
- Potential Patterns: There might be a potential double bottom forming at the 0.235-0.240 MYR level, which could indicate a possible trend reversal if confirmed.
Overall, the stock appears to be in a downtrend but showing signs of potential stabilization or reversal. Traders should watch for a confirmed break above resistance or a breakdown below support for clearer directional signals.

➀➁➂➃➄
면책사항
해당 정보와 게시물은 금융, 투자, 트레이딩 또는 기타 유형의 조언이나 권장 사항으로 간주되지 않으며, 트레이딩뷰에서 제공하거나 보증하는 것이 아닙니다. 자세한 내용은 이용 약관을 참조하세요.
➀➁➂➃➄
면책사항
해당 정보와 게시물은 금융, 투자, 트레이딩 또는 기타 유형의 조언이나 권장 사항으로 간주되지 않으며, 트레이딩뷰에서 제공하거나 보증하는 것이 아닙니다. 자세한 내용은 이용 약관을 참조하세요.