Long
✳️ Long-Term Consolidation, Another Wave | MDT (127% Potential)
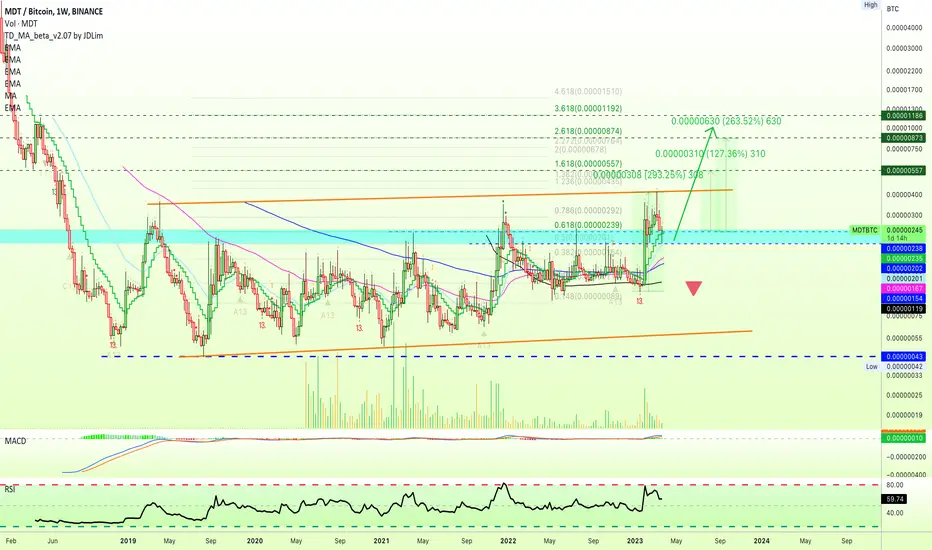
MDTBTC Is preparing for another bullish wave or so the chart says.
This pair has been range trading since 2018... Notice the huge channel (orange).
March has been a correction month so far but this week we are seeing some change.
We have a Doji with a long lower wick that tested as support EMA21 and EMA10.
The current price is back above these levels, this can lead to a bullish situation if this is confirmed once Sunday closes.
After a nice 290%, we can see additional growth.
I wouldn't be surprised if this happen.
✔️ Support levels short-term 239 and 200 sats.
119 sats for the long-term.
✔️ Resistance levels or targets, 555 the next high and higher at this point it is still hard to say...
But these levels are also mapped on the chart.
Namaste.
This pair has been range trading since 2018... Notice the huge channel (orange).
March has been a correction month so far but this week we are seeing some change.
We have a Doji with a long lower wick that tested as support EMA21 and EMA10.
The current price is back above these levels, this can lead to a bullish situation if this is confirmed once Sunday closes.
After a nice 290%, we can see additional growth.
I wouldn't be surprised if this happen.
✔️ Support levels short-term 239 and 200 sats.
119 sats for the long-term.
✔️ Resistance levels or targets, 555 the next high and higher at this point it is still hard to say...
But these levels are also mapped on the chart.
Namaste.

Trading Cryptocurrencies can be the hardest undertaking ever without the right trade-numbers, without accurate private-access information. Free is free, but the best always requires sweat, an investment. Since 2017 👇
t.me/masteranandatrades/8778
t.me/masteranandatrades/8778
관련 발행물
면책사항
해당 정보와 게시물은 금융, 투자, 트레이딩 또는 기타 유형의 조언이나 권장 사항으로 간주되지 않으며, 트레이딩뷰에서 제공하거나 보증하는 것이 아닙니다. 자세한 내용은 이용 약관을 참조하세요.
Trading Cryptocurrencies can be the hardest undertaking ever without the right trade-numbers, without accurate private-access information. Free is free, but the best always requires sweat, an investment. Since 2017 👇
t.me/masteranandatrades/8778
t.me/masteranandatrades/8778
관련 발행물
면책사항
해당 정보와 게시물은 금융, 투자, 트레이딩 또는 기타 유형의 조언이나 권장 사항으로 간주되지 않으며, 트레이딩뷰에서 제공하거나 보증하는 것이 아닙니다. 자세한 내용은 이용 약관을 참조하세요.