
Trend Structure:
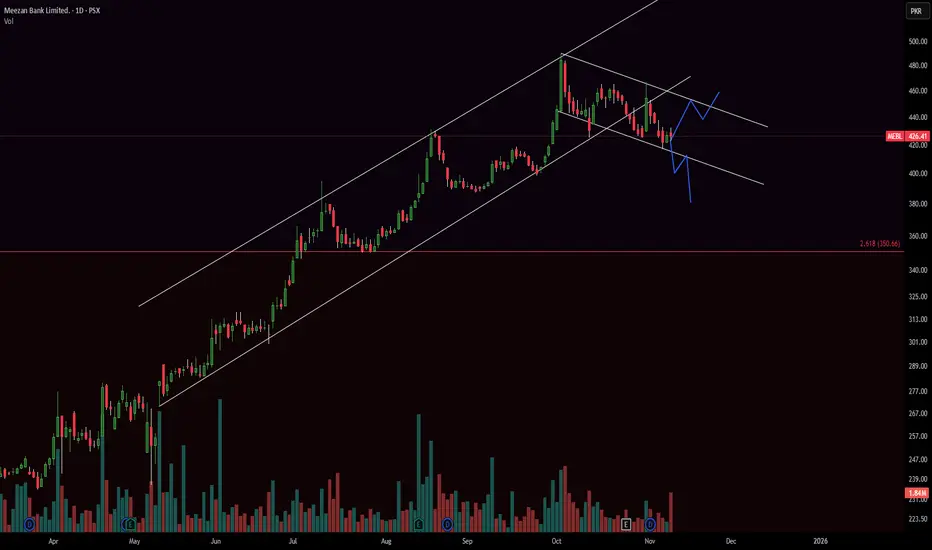
The stock was in a strong uptrend within a well-defined ascending channel from March through October, reaching a peak around 500 PKR. However, it has since broken down from this channel.
Current Situation:
Price is currently at 426.41 PKR, down 0.46%
Trading below both channel support lines
The breakdown suggests potential trend reversal or deeper correction
Key Levels:
Strong support zone around 350-360 PKR (2.618 Fibonacci extension marked)
Previous resistance-turned-support around 400-420 PKR being tested
Upper channel resistance now around 440-460 PKR
Volume:
Volume has been declining recently, showing weakening momentum after the breakdown.
Outlook:
The chart shows bearish bias after the channel breakdown. If 420 PKR support fails, the stock could retest the 350-360 PKR zone. A recovery back above 440 PKR would be needed to regain bullish momentum. The overall structure suggests the uptrend may be exhausted, at least temporarily.
Risk: The breakdown from a long-term ascending channel is typically a significant bearish signal.
The stock was in a strong uptrend within a well-defined ascending channel from March through October, reaching a peak around 500 PKR. However, it has since broken down from this channel.
Current Situation:
Price is currently at 426.41 PKR, down 0.46%
Trading below both channel support lines
The breakdown suggests potential trend reversal or deeper correction
Key Levels:
Strong support zone around 350-360 PKR (2.618 Fibonacci extension marked)
Previous resistance-turned-support around 400-420 PKR being tested
Upper channel resistance now around 440-460 PKR
Volume:
Volume has been declining recently, showing weakening momentum after the breakdown.
Outlook:
The chart shows bearish bias after the channel breakdown. If 420 PKR support fails, the stock could retest the 350-360 PKR zone. A recovery back above 440 PKR would be needed to regain bullish momentum. The overall structure suggests the uptrend may be exhausted, at least temporarily.
Risk: The breakdown from a long-term ascending channel is typically a significant bearish signal.

관련 발행물
면책사항
해당 정보와 게시물은 금융, 투자, 트레이딩 또는 기타 유형의 조언이나 권장 사항으로 간주되지 않으며, 트레이딩뷰에서 제공하거나 보증하는 것이 아닙니다. 자세한 내용은 이용 약관을 참조하세요.
면책사항
해당 정보와 게시물은 금융, 투자, 트레이딩 또는 기타 유형의 조언이나 권장 사항으로 간주되지 않으며, 트레이딩뷰에서 제공하거나 보증하는 것이 아닙니다. 자세한 내용은 이용 약관을 참조하세요.