Analyse
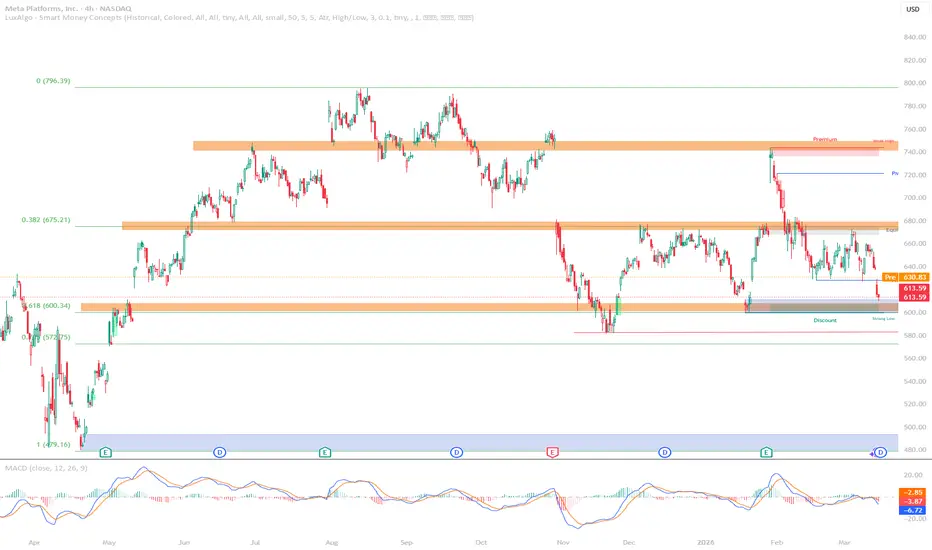
 META is currently trading near the lower boundary of a consolidation range after rejecting the premium zone around 740–750.
That rejection marked a clear shift in momentum, with sellers stepping in aggressively and pushing price back toward the discount side of the structure.
Recently, price also broke below the previous weekly low around 630, which signals that the market has already started collecting liquidity on the downside.
Now META is approaching the discount zone near 600, a level that many traders are likely watching as support.
However, when a level becomes this obvious, markets often move slightly beyond it to sweep liquidity before deciding the next direction.
Key levels I'm watching
Resistance / Liquidity zone
660 – 670 area
This zone represents the equilibrium of the range and a potential level where price could react if a rebound occurs.
Support / Discount zone
600 area
This is the current discount zone where price is approaching a cluster of liquidity below recent lows.
Possible scenario
One scenario that stands out on the chart is a liquidity sweep below the 600 level.
Markets frequently push slightly beyond visible support levels to trigger stops before reversing.
If that happens, META could briefly move into the 585–600 area, where previous structure and discount pricing align.
From there, buyers may step in and rotate price back toward the equilibrium zone near 660.
Bearish scenario
If price fails to reclaim the 630 level, sellers could maintain control and extend the correction toward the 570 area, which aligns with deeper retracement levels.
Interesting observation
While studying this chart, one thing that stands out is how obvious the 600 level has become.
When support levels become widely visible, markets often move beyond them to collect liquidity before the next move.
Because of that, a sweep below the current lows would not be surprising before any meaningful rebound.
Trading approach
For this trade, I’ve already taken a position at 605 with a small size and a tight stop-loss .
However, if the market moves lower and goes to hunt liquidity around the 585 area, my current position would likely be stopped out with a small loss. In that case, my buy limit order would be triggered at that level. I’m using Bitget CFDs for this setup, which allows me to place and manage these orders more flexibly. This approach makes more sense to me than using a wide stop-loss, since it lets the market reach the deeper liquidity zone while keeping the risk controlled.
Question
Do you think META sweeps liquidity below $600 first,
or does the market rebound from the current discount zone?
META is currently trading near the lower boundary of a consolidation range after rejecting the premium zone around 740–750.That rejection marked a clear shift in momentum, with sellers stepping in aggressively and pushing price back toward the discount side of the structure.
Recently, price also broke below the previous weekly low around 630, which signals that the market has already started collecting liquidity on the downside.
Now META is approaching the discount zone near 600, a level that many traders are likely watching as support.
However, when a level becomes this obvious, markets often move slightly beyond it to sweep liquidity before deciding the next direction.
Key levels I'm watching
Resistance / Liquidity zone
660 – 670 area
This zone represents the equilibrium of the range and a potential level where price could react if a rebound occurs.
Support / Discount zone
600 area
This is the current discount zone where price is approaching a cluster of liquidity below recent lows.
Possible scenario
One scenario that stands out on the chart is a liquidity sweep below the 600 level.
Markets frequently push slightly beyond visible support levels to trigger stops before reversing.
If that happens, META could briefly move into the 585–600 area, where previous structure and discount pricing align.
From there, buyers may step in and rotate price back toward the equilibrium zone near 660.
Bearish scenario
If price fails to reclaim the 630 level, sellers could maintain control and extend the correction toward the 570 area, which aligns with deeper retracement levels.
Interesting observation
While studying this chart, one thing that stands out is how obvious the 600 level has become.
When support levels become widely visible, markets often move beyond them to collect liquidity before the next move.
Because of that, a sweep below the current lows would not be surprising before any meaningful rebound.
Trading approach
For this trade, I’ve already taken a position at 605 with a small size and a tight stop-loss .
However, if the market moves lower and goes to hunt liquidity around the 585 area, my current position would likely be stopped out with a small loss. In that case, my buy limit order would be triggered at that level. I’m using Bitget CFDs for this setup, which allows me to place and manage these orders more flexibly. This approach makes more sense to me than using a wide stop-loss, since it lets the market reach the deeper liquidity zone while keeping the risk controlled.
Question
Do you think META sweeps liquidity below $600 first,
or does the market rebound from the current discount zone?

면책사항
해당 정보와 게시물은 금융, 투자, 트레이딩 또는 기타 유형의 조언이나 권장 사항으로 간주되지 않으며, 트레이딩뷰에서 제공하거나 보증하는 것이 아닙니다. 자세한 내용은 이용 약관을 참조하세요.
면책사항
해당 정보와 게시물은 금융, 투자, 트레이딩 또는 기타 유형의 조언이나 권장 사항으로 간주되지 않으며, 트레이딩뷰에서 제공하거나 보증하는 것이 아닙니다. 자세한 내용은 이용 약관을 참조하세요.