
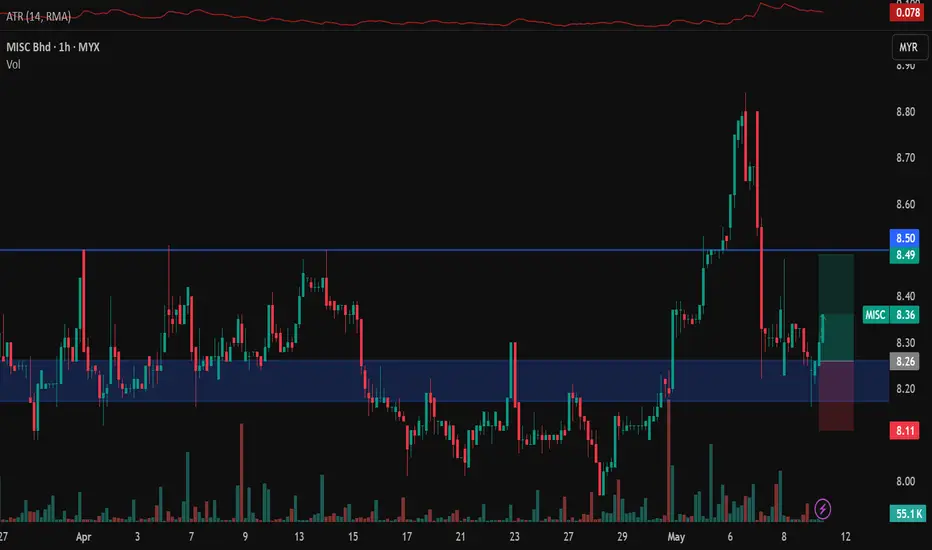
Price broke a multi-month level with high volume on the move leading towards the breakout on the 4hr chart. Then on the pullback, big large candles formed but with low volume signalling the strength during the move down wasn't because of the bearish volume but lack of buying pressure. On the 1hr chart, a double bottom formed and entry is on the green candle at the second bottom. Stops is below the lows and tp is before the next resistance level.

면책사항
해당 정보와 게시물은 금융, 투자, 트레이딩 또는 기타 유형의 조언이나 권장 사항으로 간주되지 않으며, 트레이딩뷰에서 제공하거나 보증하는 것이 아닙니다. 자세한 내용은 이용 약관을 참조하세요.
면책사항
해당 정보와 게시물은 금융, 투자, 트레이딩 또는 기타 유형의 조언이나 권장 사항으로 간주되지 않으며, 트레이딩뷰에서 제공하거나 보증하는 것이 아닙니다. 자세한 내용은 이용 약관을 참조하세요.