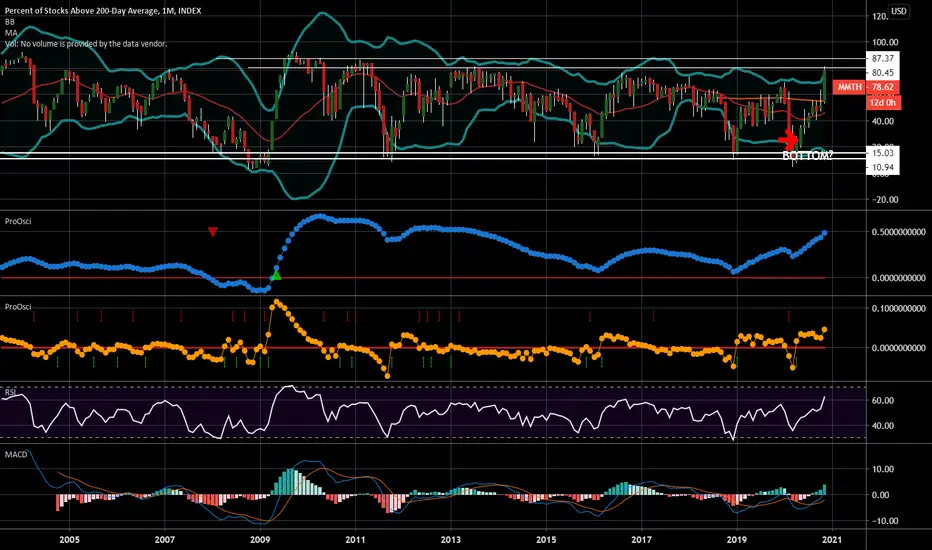
This chart is the monthly chart of % of stocks above their 200 Day Moving Average and when it gets to these levels the market will reverse direction. Greed is at extreme and the RISK greatly outweighs the potential return on a portfolio. Now would be the time to tighten up stop losses, reduce positions or outright sell positions as the market is vulnerable to bad news and could collapse quickly.

면책사항
해당 정보와 게시물은 금융, 투자, 트레이딩 또는 기타 유형의 조언이나 권장 사항으로 간주되지 않으며, 트레이딩뷰에서 제공하거나 보증하는 것이 아닙니다. 자세한 내용은 이용 약관을 참조하세요.
면책사항
해당 정보와 게시물은 금융, 투자, 트레이딩 또는 기타 유형의 조언이나 권장 사항으로 간주되지 않으며, 트레이딩뷰에서 제공하거나 보증하는 것이 아닙니다. 자세한 내용은 이용 약관을 참조하세요.