
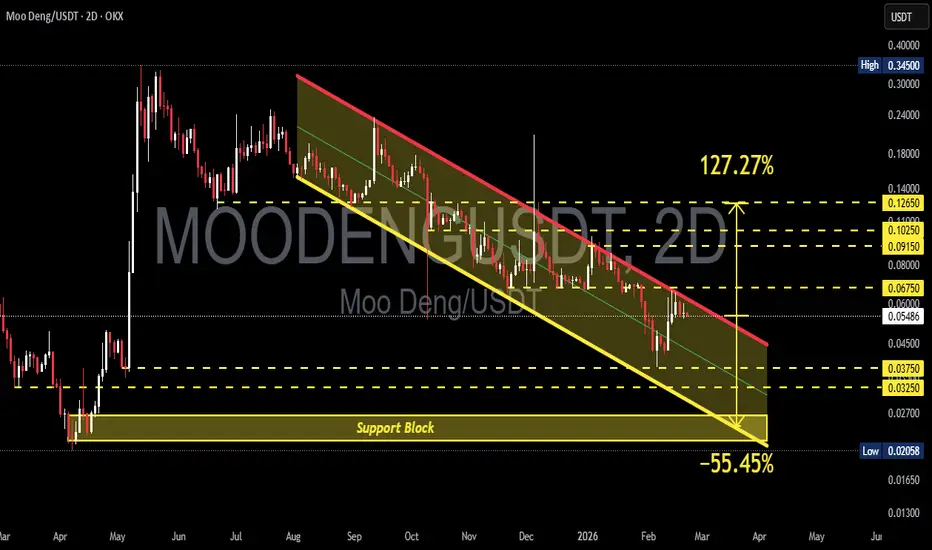
On the 2D timeframe, MOODENG/USDT has been moving within a controlled downtrend structure since August 2025. Price continues to form consistent lower highs and lower lows, indicating mid-term seller dominance.
Currently, price is trading inside a descending channel and approaching the upper trendline resistance (red line). On the lower side, there is a strong support block at 0.0265 – 0.0220, acting as the main demand zone.
The structure is now at a decision point.
---
Pattern Structure – Descending Channel
Technically, the chart forms a large Descending Channel:
Upper red line: dynamic descending resistance
Lower yellow line: dynamic descending support
Price movement is structured, bouncing from top to bottom within the channel
Trend remains bearish as long as price stays inside the channel
Characteristics of a descending channel:
Typically reflects a controlled downtrend
A breakout above can signal the beginning of a trend reversal
A breakdown below accelerates bearish continuation
A valid breakout requires a strong candle close above the red trendline, ideally supported by increasing volume.
---
Key Levels
Resistance levels:
0.0675
0.0915
0.1025
0.1265 (major breakout confirmation)
Support levels:
0.0375
0.0325
Strong support block: 0.0265 – 0.0220
The 0.0265 – 0.0220 zone is a major demand area that previously triggered a strong impulsive move.
---
Bullish Scenario
Requirements:
Strong break and close above the red trendline
Volume expansion
Reclaim of 0.0675
Targets:
1. 0.0915
2. 0.1025
3. 0.1265 (structure shift confirmation)
4. If momentum accelerates, potential expansion up to +127% from the current area
If 0.1265 is broken and held as support, the structure shifts into a bullish market structure change.
---
Bearish Scenario
Requirements:
Strong rejection at the red trendline
Breakdown below 0.0375
Price exits the channel to the downside
Downside targets:
1. 0.0325
2. Support block 0.0265 – 0.0220
If the support block fails, there is potential for approximately -55% decline toward previous lows.
A breakdown below 0.0220 would confirm continuation of the macro downtrend.
---
Conclusion
MOODENG is trading inside a large descending channel and is currently at a critical zone. As long as price remains inside the channel, the trend remains bearish.
A breakout to the upside could trigger a 100%+ rally.
However, losing the 0.0265 – 0.0220 support block would extend the bearish structure significantly.
This is a high risk – high reward area.
Trade confirmation, not prediction.
#MOODENG #MOODENGUSDT #CryptoAnalysis #AltcoinSetup #TechnicalAnalysis #DescendingChannel #SupportResistance #BullishScenario #BearishScenario
Currently, price is trading inside a descending channel and approaching the upper trendline resistance (red line). On the lower side, there is a strong support block at 0.0265 – 0.0220, acting as the main demand zone.
The structure is now at a decision point.
---
Pattern Structure – Descending Channel
Technically, the chart forms a large Descending Channel:
Upper red line: dynamic descending resistance
Lower yellow line: dynamic descending support
Price movement is structured, bouncing from top to bottom within the channel
Trend remains bearish as long as price stays inside the channel
Characteristics of a descending channel:
Typically reflects a controlled downtrend
A breakout above can signal the beginning of a trend reversal
A breakdown below accelerates bearish continuation
A valid breakout requires a strong candle close above the red trendline, ideally supported by increasing volume.
---
Key Levels
Resistance levels:
0.0675
0.0915
0.1025
0.1265 (major breakout confirmation)
Support levels:
0.0375
0.0325
Strong support block: 0.0265 – 0.0220
The 0.0265 – 0.0220 zone is a major demand area that previously triggered a strong impulsive move.
---
Bullish Scenario
Requirements:
Strong break and close above the red trendline
Volume expansion
Reclaim of 0.0675
Targets:
1. 0.0915
2. 0.1025
3. 0.1265 (structure shift confirmation)
4. If momentum accelerates, potential expansion up to +127% from the current area
If 0.1265 is broken and held as support, the structure shifts into a bullish market structure change.
---
Bearish Scenario
Requirements:
Strong rejection at the red trendline
Breakdown below 0.0375
Price exits the channel to the downside
Downside targets:
1. 0.0325
2. Support block 0.0265 – 0.0220
If the support block fails, there is potential for approximately -55% decline toward previous lows.
A breakdown below 0.0220 would confirm continuation of the macro downtrend.
---
Conclusion
MOODENG is trading inside a large descending channel and is currently at a critical zone. As long as price remains inside the channel, the trend remains bearish.
A breakout to the upside could trigger a 100%+ rally.
However, losing the 0.0265 – 0.0220 support block would extend the bearish structure significantly.
This is a high risk – high reward area.
Trade confirmation, not prediction.
#MOODENG #MOODENGUSDT #CryptoAnalysis #AltcoinSetup #TechnicalAnalysis #DescendingChannel #SupportResistance #BullishScenario #BearishScenario

✅ Get Free Signals! Join Our Telegram Channel Here: t.me/TheCryptoNuclear
✅ Twitter: twitter.com/crypto_nuclear
✅ Join Bybit : partner.bybit.com/b/nuclearvip
✅ Benefits : Lifetime Trading Fee Discount -50%
✅ Twitter: twitter.com/crypto_nuclear
✅ Join Bybit : partner.bybit.com/b/nuclearvip
✅ Benefits : Lifetime Trading Fee Discount -50%
면책사항
해당 정보와 게시물은 금융, 투자, 트레이딩 또는 기타 유형의 조언이나 권장 사항으로 간주되지 않으며, 트레이딩뷰에서 제공하거나 보증하는 것이 아닙니다. 자세한 내용은 이용 약관을 참조하세요.
✅ Get Free Signals! Join Our Telegram Channel Here: t.me/TheCryptoNuclear
✅ Twitter: twitter.com/crypto_nuclear
✅ Join Bybit : partner.bybit.com/b/nuclearvip
✅ Benefits : Lifetime Trading Fee Discount -50%
✅ Twitter: twitter.com/crypto_nuclear
✅ Join Bybit : partner.bybit.com/b/nuclearvip
✅ Benefits : Lifetime Trading Fee Discount -50%
면책사항
해당 정보와 게시물은 금융, 투자, 트레이딩 또는 기타 유형의 조언이나 권장 사항으로 간주되지 않으며, 트레이딩뷰에서 제공하거나 보증하는 것이 아닙니다. 자세한 내용은 이용 약관을 참조하세요.