
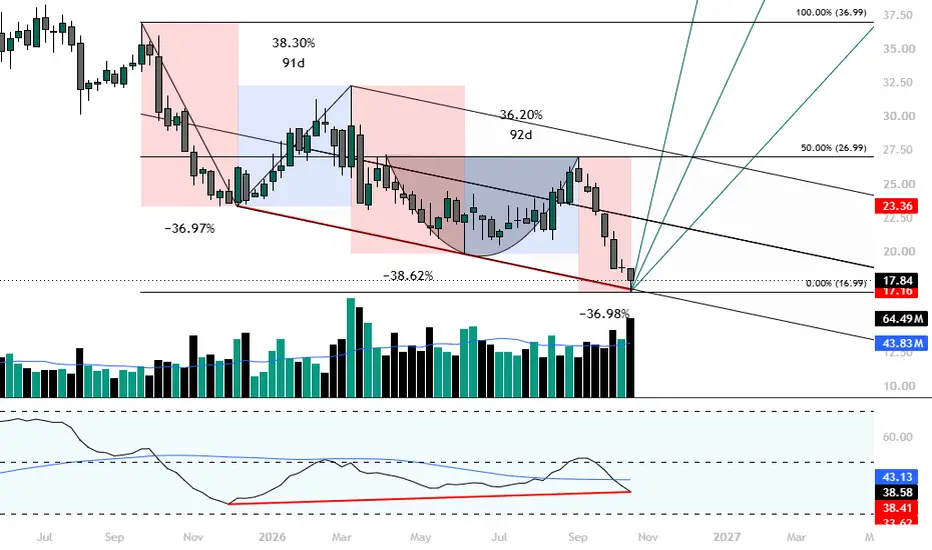
On the weekly timeframe mosaic is showing an harmonically pleasing 3 Drives. The 3 drives down are highlighted in red, the corrections in blue. WE also have a Schiff pitchfork from the top of the pattern aligning quite closely with last weeks close.
The harmonic 3 Drive pattern consists of 3 dramatic falls in price. These are intersected with 2 corrections which are usually similar or identical in price and time, as you may notice this pattern displays this almost to perfection.
The "ARC" or bowl in the centre is possibly the beginning of an Adam n Eve pattern, a type of double bottom pattern. interestingly the Arc aligns with the 50% line of the overall pattern.
For confluence I have added the volume indicator which shows us we may have had a selling climax event with way above average volume on weekly.
The RSI has been added to show a divergence between price and oscillator.
All together an overall pleasing harmonic arrangement with confluence as a bonus.
Lets see what next week brings.
The harmonic 3 Drive pattern consists of 3 dramatic falls in price. These are intersected with 2 corrections which are usually similar or identical in price and time, as you may notice this pattern displays this almost to perfection.
The "ARC" or bowl in the centre is possibly the beginning of an Adam n Eve pattern, a type of double bottom pattern. interestingly the Arc aligns with the 50% line of the overall pattern.
For confluence I have added the volume indicator which shows us we may have had a selling climax event with way above average volume on weekly.
The RSI has been added to show a divergence between price and oscillator.
All together an overall pleasing harmonic arrangement with confluence as a bonus.
Lets see what next week brings.

면책사항
해당 정보와 게시물은 금융, 투자, 트레이딩 또는 기타 유형의 조언이나 권장 사항으로 간주되지 않으며, 트레이딩뷰에서 제공하거나 보증하는 것이 아닙니다. 자세한 내용은 이용 약관을 참조하세요.
면책사항
해당 정보와 게시물은 금융, 투자, 트레이딩 또는 기타 유형의 조언이나 권장 사항으로 간주되지 않으며, 트레이딩뷰에서 제공하거나 보증하는 것이 아닙니다. 자세한 내용은 이용 약관을 참조하세요.