
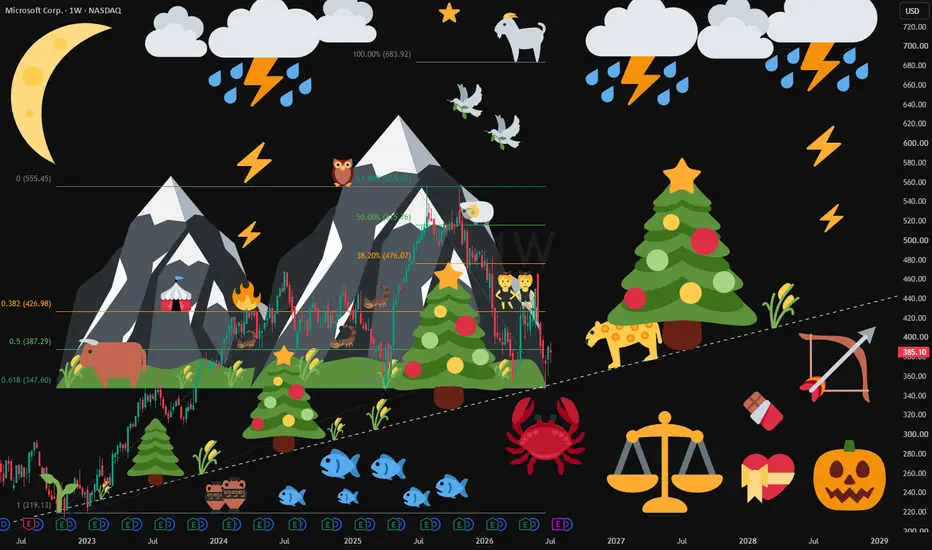
A rare structural asymmetry has been developing in the equity markets. While the S&P 500's 9.6% year-to-date return establishes a powerful macroeconomic floor, Microsoft has decoupled from the index by undergoing a -30% correction. This combination of an index momentum cycle and a discounted mega-cap growth leader presents a compelling thesis.
The broader market enters the second half of the year backed by strong cyclical momentum, where front-half strength historically serves as a launchpad:
- The S&P 500’s 9.6% YTD return crosses a historical threshold.
- Since 1990, every calendar year clearing this mid-year bar finished the S&P 500 in positive territory.
- Post-milestone, the index has historically generated an additional median gain of 9.8% over the final six months.
To maximize this expansion, capital naturally rotates toward premium growth engines. Microsoft’s retreat to the $385 range; driven by AI capital expenditure fears, presents a disconnect against its high-velocity operational metrics:
- Microsoft’s annualized AI revenue run rate has surged past $37 billion (up 123% YoY).
- The company's contracted commercial backlog stands at $627 billion, proving capex matches enterprise demand.
- This correction dragged Microsoft’s forward P/E down to 22.9x, now discounted cash flow models suggest a 45% upside within one year.
Just as front-half momentum historically breeds back-half strength for the S&P 500, a heavily compressed mega-cap leader builds the coiled-spring energy needed to fuel an index expansion. For individuals tracking this cycle, Microsoft represents a premier large-cap vehicle positioned to lead the market's second-half momentum.
The broader market enters the second half of the year backed by strong cyclical momentum, where front-half strength historically serves as a launchpad:
- The S&P 500’s 9.6% YTD return crosses a historical threshold.
- Since 1990, every calendar year clearing this mid-year bar finished the S&P 500 in positive territory.
- Post-milestone, the index has historically generated an additional median gain of 9.8% over the final six months.
To maximize this expansion, capital naturally rotates toward premium growth engines. Microsoft’s retreat to the $385 range; driven by AI capital expenditure fears, presents a disconnect against its high-velocity operational metrics:
- Microsoft’s annualized AI revenue run rate has surged past $37 billion (up 123% YoY).
- The company's contracted commercial backlog stands at $627 billion, proving capex matches enterprise demand.
- This correction dragged Microsoft’s forward P/E down to 22.9x, now discounted cash flow models suggest a 45% upside within one year.
Just as front-half momentum historically breeds back-half strength for the S&P 500, a heavily compressed mega-cap leader builds the coiled-spring energy needed to fuel an index expansion. For individuals tracking this cycle, Microsoft represents a premier large-cap vehicle positioned to lead the market's second-half momentum.

면책사항
해당 정보와 게시물은 금융, 투자, 트레이딩 또는 기타 유형의 조언이나 권장 사항으로 간주되지 않으며, 트레이딩뷰에서 제공하거나 보증하는 것이 아닙니다. 자세한 내용은 이용 약관을 참조하세요.
면책사항
해당 정보와 게시물은 금융, 투자, 트레이딩 또는 기타 유형의 조언이나 권장 사항으로 간주되지 않으며, 트레이딩뷰에서 제공하거나 보증하는 것이 아닙니다. 자세한 내용은 이용 약관을 참조하세요.