
Hi traders
Ever woundered - "can i beat the market ?" or "what is my Edge ?"
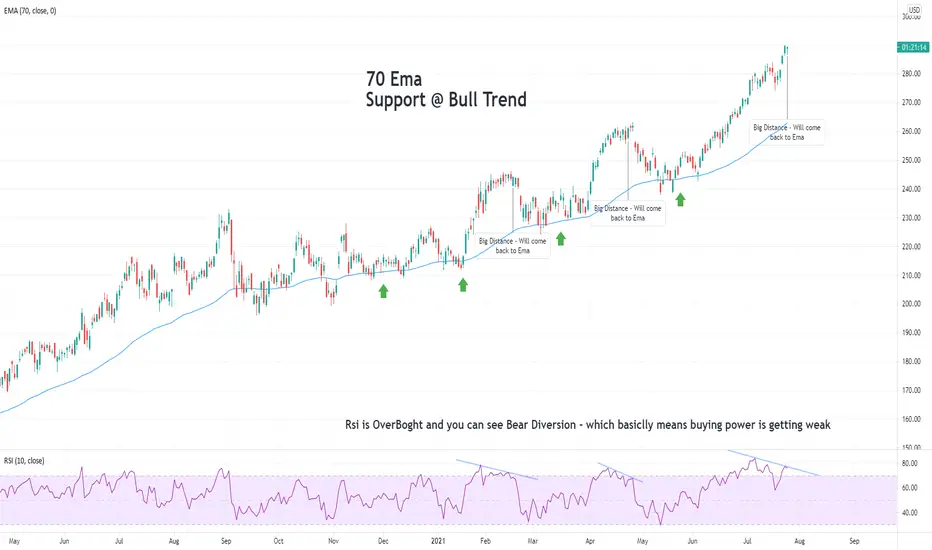
try the 70 Ema !!
i will use daily chart
and look for clear trend direction
apply indicator called Moving Avarage Exponential and set it to 70
-- UPTREND --
on an uptrend look if the line support the price.
you will want to go long when price reach the blue line.
on the other hand, price tends to "come back" to the Ema, so you can try short if price is to far up (see microsoft chart)
combined with RSI indicator, you can get better feeling if the price is overboght (and go short) or oversold (and go long)
-- DOWNTREND --
On downtrend the 70 Ema will act as RESISTANCE - see BABA chart
same here - price tends to "come back" to the Ema ...
Good Luck
Ever woundered - "can i beat the market ?" or "what is my Edge ?"
try the 70 Ema !!
i will use daily chart
and look for clear trend direction
apply indicator called Moving Avarage Exponential and set it to 70
-- UPTREND --
on an uptrend look if the line support the price.
you will want to go long when price reach the blue line.
on the other hand, price tends to "come back" to the Ema, so you can try short if price is to far up (see microsoft chart)
combined with RSI indicator, you can get better feeling if the price is overboght (and go short) or oversold (and go long)
-- DOWNTREND --
On downtrend the 70 Ema will act as RESISTANCE - see
BABA chart same here - price tends to "come back" to the Ema ...
Good Luck
노트
DowntrendBABA노트
Price will come back to EMA

면책사항
해당 정보와 게시물은 금융, 투자, 트레이딩 또는 기타 유형의 조언이나 권장 사항으로 간주되지 않으며, 트레이딩뷰에서 제공하거나 보증하는 것이 아닙니다. 자세한 내용은 이용 약관을 참조하세요.
면책사항
해당 정보와 게시물은 금융, 투자, 트레이딩 또는 기타 유형의 조언이나 권장 사항으로 간주되지 않으며, 트레이딩뷰에서 제공하거나 보증하는 것이 아닙니다. 자세한 내용은 이용 약관을 참조하세요.