
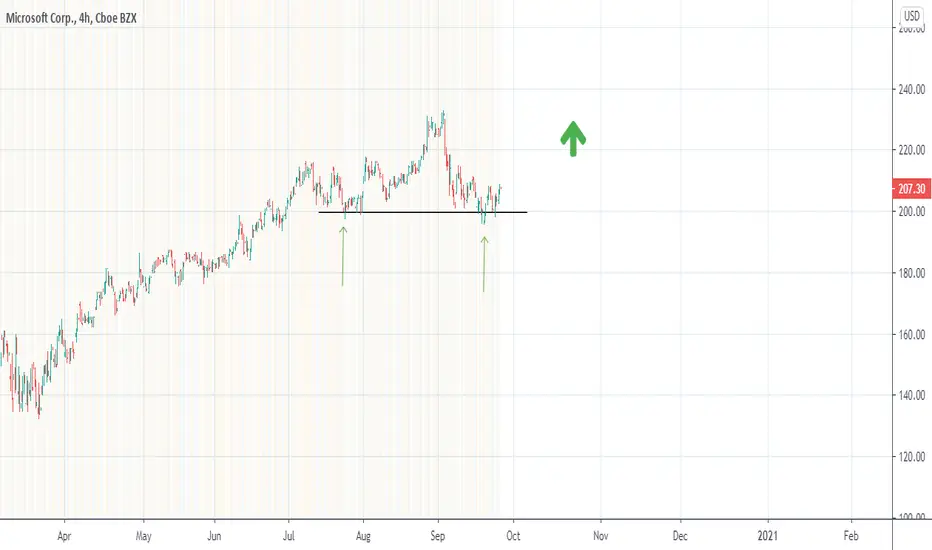
After the fall of these last weeks (fall that has occurred in all markets, not in Microsoft exclusively), a rejection at lower prices appears again (the last arrow), prices that have already been tested (in the first arrow)
Is this a double bottom pattern or is it in range?
I would say that it is a semi-range with greatly bullish connotations, personally I would open a bullish ratio straddle 2: 1
Is this a double bottom pattern or is it in range?
I would say that it is a semi-range with greatly bullish connotations, personally I would open a bullish ratio straddle 2: 1

면책사항
해당 정보와 게시물은 금융, 투자, 트레이딩 또는 기타 유형의 조언이나 권장 사항으로 간주되지 않으며, 트레이딩뷰에서 제공하거나 보증하는 것이 아닙니다. 자세한 내용은 이용 약관을 참조하세요.
면책사항
해당 정보와 게시물은 금융, 투자, 트레이딩 또는 기타 유형의 조언이나 권장 사항으로 간주되지 않으며, 트레이딩뷰에서 제공하거나 보증하는 것이 아닙니다. 자세한 내용은 이용 약관을 참조하세요.