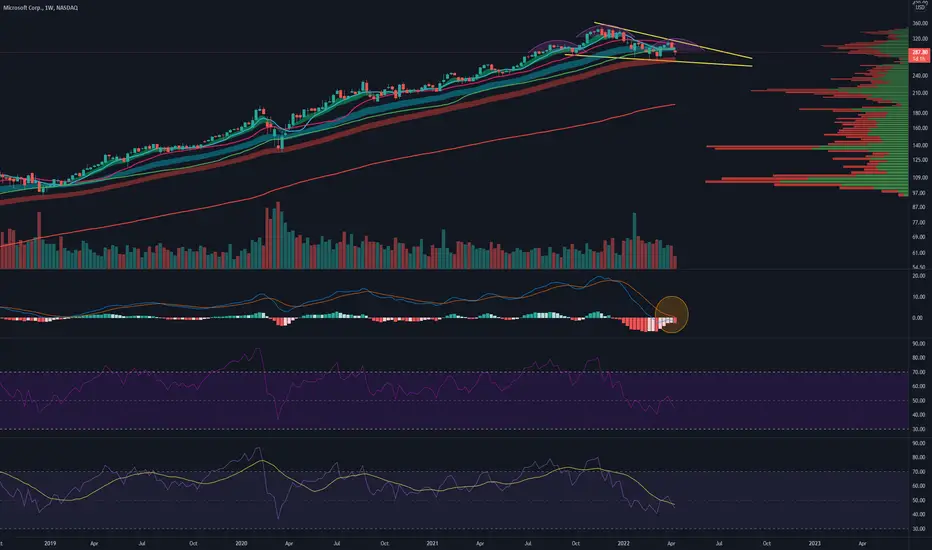
Bull Scenario = Falling wedge with a push off the 72/89 EMA cloud.
Bear Scenario = Inverted head and shoulders pattern with a failed bounce off the 72/89 EMA.
MACD may be stalling and curling. This is a weekly chart so a bit more macro.
 MSFT
MSFT
Bear Scenario = Inverted head and shoulders pattern with a failed bounce off the 72/89 EMA.
MACD may be stalling and curling. This is a weekly chart so a bit more macro.
MSFT노트
Looking more and more bearish. Testing that 72/89 EMA cloud. If it starts to really test that lower trend line of the wedge, I think that we're going to see the price fall. Given macro trends, I think the market is pricing this in now vs. the future when additional rate hikes happen.노트
Once again testing the 72/89 EMA cloud further. Downside targets would be $233 and $213 if it falls out to the downside.
면책사항
해당 정보와 게시물은 금융, 투자, 트레이딩 또는 기타 유형의 조언이나 권장 사항으로 간주되지 않으며, 트레이딩뷰에서 제공하거나 보증하는 것이 아닙니다. 자세한 내용은 이용 약관을 참조하세요.
면책사항
해당 정보와 게시물은 금융, 투자, 트레이딩 또는 기타 유형의 조언이나 권장 사항으로 간주되지 않으며, 트레이딩뷰에서 제공하거나 보증하는 것이 아닙니다. 자세한 내용은 이용 약관을 참조하세요.