
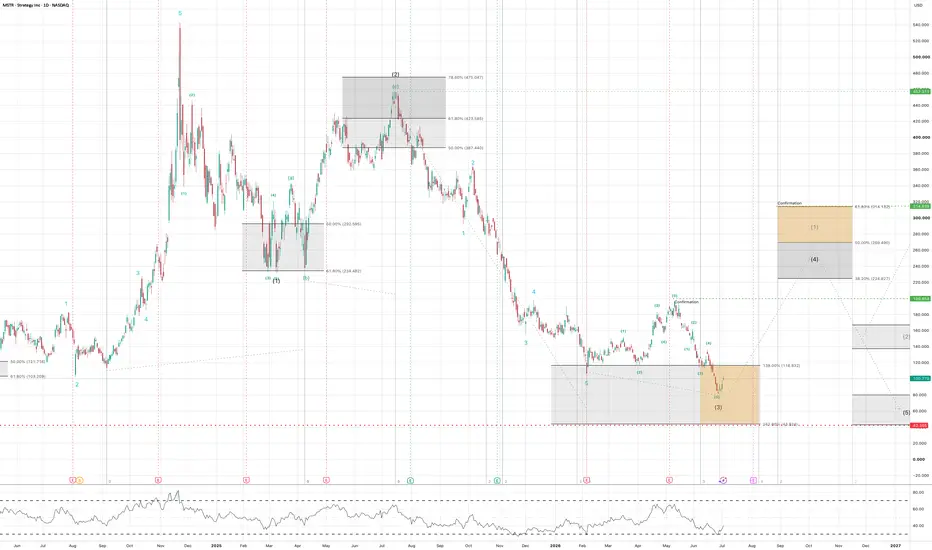
MSTR | Strategy Inc. | 1D
Core Idea
MSTR is trading at a major Elliott Wave decision point.
The current reaction from the orange zone can be read in two ways:
bearish count: the bounce becomes Wave (4), followed by a final Wave (5) lower
bullish alternative: the same move develops as a new impulsive Wave (1), followed by a corrective Wave (2)
That makes the next recovery phase very important. The structure of the bounce matters more than the bounce itself.
Current Structure
The decline from the 457 area still looks impulsive on the higher timeframe.
The current low was reached inside the orange projection zone, near the 138.0% extension at 116.832 and above the deeper 161.8% area around 43.824. The reaction is constructive, but it has not yet confirmed a full trend reversal.
The first important confirmation is 199.854. Above that level, the recovery can extend into the larger 224.827 to 314.152 zone.
Bearish Count
In the bearish count, the current rebound is only Wave (4) of the larger decline.
The projected Wave (4) area sits between:
224.827: 38.2% retracement
269.490: 50.0% retracement
314.152: 61.8% retracement
If price rejects from that zone, a final Wave (5) lower remains possible. The lower target area would then be around 80.021 first, with a deeper extension toward 43.824 to 42.785.
Bullish Alternative
The alternative count becomes interesting if the recovery from the orange zone unfolds impulsively.
In that case, the market may not be building a bearish Wave (4), but a new bullish Wave (1). A later pullback into the projected Wave (2) zone would then be the key test.
The preferred Wave (2) support zone after a bullish impulse would be:
167.163: 50.0% retracement
137.613: 61.8% retracement
If that pullback holds corrective and price turns higher again, the bullish count becomes much stronger.
Key Levels
116.832: current reaction / 138.0% extension
100.770: current price area
80.021: deeper bearish target
43.824 to 42.785: extreme lower target zone
199.854: first recovery confirmation
224.827 to 314.152: Wave (4) or bullish Wave (1) target zone
314.639: larger bullish confirmation
167.163 to 137.613: future Wave (2) support if the bullish count activates
Trading Interpretation
The setup is not about guessing the bottom.
The market first needs to show whether the current rebound is corrective or impulsive. A weak three-wave recovery into 224 to 314 would favor the bearish Wave (4) count. A strong impulsive advance followed by a controlled Wave (2) pullback would favor the bullish alternative.
Momentum is improving from a depressed area, but confirmation is still required.
Conclusion
MSTR is at a major count decision.
Below 199.854, the bearish structure remains dominant. Above 199.854, the recovery can extend into the Wave (4) / Wave (1) decision zone. The real signal comes afterward: rejection favors Wave (5) lower, while an impulsive recovery and corrective Wave (2) would shift the chart into a bullish reversal structure.
Core Idea
MSTR is trading at a major Elliott Wave decision point.
The current reaction from the orange zone can be read in two ways:
bearish count: the bounce becomes Wave (4), followed by a final Wave (5) lower
bullish alternative: the same move develops as a new impulsive Wave (1), followed by a corrective Wave (2)
That makes the next recovery phase very important. The structure of the bounce matters more than the bounce itself.
Current Structure
The decline from the 457 area still looks impulsive on the higher timeframe.
The current low was reached inside the orange projection zone, near the 138.0% extension at 116.832 and above the deeper 161.8% area around 43.824. The reaction is constructive, but it has not yet confirmed a full trend reversal.
The first important confirmation is 199.854. Above that level, the recovery can extend into the larger 224.827 to 314.152 zone.
Bearish Count
In the bearish count, the current rebound is only Wave (4) of the larger decline.
The projected Wave (4) area sits between:
224.827: 38.2% retracement
269.490: 50.0% retracement
314.152: 61.8% retracement
If price rejects from that zone, a final Wave (5) lower remains possible. The lower target area would then be around 80.021 first, with a deeper extension toward 43.824 to 42.785.
Bullish Alternative
The alternative count becomes interesting if the recovery from the orange zone unfolds impulsively.
In that case, the market may not be building a bearish Wave (4), but a new bullish Wave (1). A later pullback into the projected Wave (2) zone would then be the key test.
The preferred Wave (2) support zone after a bullish impulse would be:
167.163: 50.0% retracement
137.613: 61.8% retracement
If that pullback holds corrective and price turns higher again, the bullish count becomes much stronger.
Key Levels
116.832: current reaction / 138.0% extension
100.770: current price area
80.021: deeper bearish target
43.824 to 42.785: extreme lower target zone
199.854: first recovery confirmation
224.827 to 314.152: Wave (4) or bullish Wave (1) target zone
314.639: larger bullish confirmation
167.163 to 137.613: future Wave (2) support if the bullish count activates
Trading Interpretation
The setup is not about guessing the bottom.
The market first needs to show whether the current rebound is corrective or impulsive. A weak three-wave recovery into 224 to 314 would favor the bearish Wave (4) count. A strong impulsive advance followed by a controlled Wave (2) pullback would favor the bullish alternative.
Momentum is improving from a depressed area, but confirmation is still required.
Conclusion
MSTR is at a major count decision.
Below 199.854, the bearish structure remains dominant. Above 199.854, the recovery can extend into the Wave (4) / Wave (1) decision zone. The real signal comes afterward: rejection favors Wave (5) lower, while an impulsive recovery and corrective Wave (2) would shift the chart into a bullish reversal structure.

면책사항
해당 정보와 게시물은 금융, 투자, 트레이딩 또는 기타 유형의 조언이나 권장 사항으로 간주되지 않으며, 트레이딩뷰에서 제공하거나 보증하는 것이 아닙니다. 자세한 내용은 이용 약관을 참조하세요.
면책사항
해당 정보와 게시물은 금융, 투자, 트레이딩 또는 기타 유형의 조언이나 권장 사항으로 간주되지 않으며, 트레이딩뷰에서 제공하거나 보증하는 것이 아닙니다. 자세한 내용은 이용 약관을 참조하세요.