
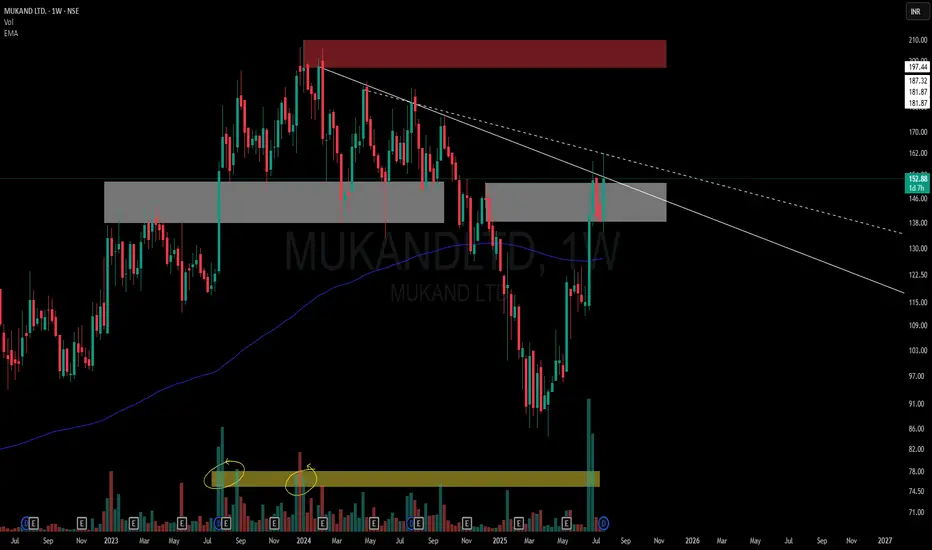
This chart is a visual case study of how price behaves when historic supply meets structural compression.
📌 Structural Highlights:
⚪ Primary Descending Trendline – Clean and persistent resistance from the top, still unbroken in a meaningful way.
▫️ Secondary Dotted Trendline – Shorter-term descending pressure also in play, giving us a dual resistance dynamic.
🟫 Strong Overhead Supply – Marked in red, this zone has held significance multiple times in the past.
⚪ Active Flip Zone – A broad grey zone showing a role reversal from supply to demand, currently interacting with price again.
📊 Volume Belt:
-Highlighted Yellow Volume Belt at the bottom shows repeated heavy interest.
🧠 Not a call – Just a neutral lens on structural context and how the market respects its own footprints.
📌 Structural Highlights:
⚪ Primary Descending Trendline – Clean and persistent resistance from the top, still unbroken in a meaningful way.
▫️ Secondary Dotted Trendline – Shorter-term descending pressure also in play, giving us a dual resistance dynamic.
🟫 Strong Overhead Supply – Marked in red, this zone has held significance multiple times in the past.
⚪ Active Flip Zone – A broad grey zone showing a role reversal from supply to demand, currently interacting with price again.
📊 Volume Belt:
-Highlighted Yellow Volume Belt at the bottom shows repeated heavy interest.
🧠 Not a call – Just a neutral lens on structural context and how the market respects its own footprints.

🎁 Get 1–2 free swing picks/month on Telegram:
t.me/hashtaghammer
📲 Enquire about stock recommendation services - WhatsApp “Hi”
wa.me/919455664601
Apoorv Dubey | SEBI RA | INH000030287
t.me/hashtaghammer
📲 Enquire about stock recommendation services - WhatsApp “Hi”
wa.me/919455664601
Apoorv Dubey | SEBI RA | INH000030287
관련 발행물
면책사항
해당 정보와 게시물은 금융, 투자, 트레이딩 또는 기타 유형의 조언이나 권장 사항으로 간주되지 않으며, 트레이딩뷰에서 제공하거나 보증하는 것이 아닙니다. 자세한 내용은 이용 약관을 참조하세요.
🎁 Get 1–2 free swing picks/month on Telegram:
t.me/hashtaghammer
📲 Enquire about stock recommendation services - WhatsApp “Hi”
wa.me/919455664601
Apoorv Dubey | SEBI RA | INH000030287
t.me/hashtaghammer
📲 Enquire about stock recommendation services - WhatsApp “Hi”
wa.me/919455664601
Apoorv Dubey | SEBI RA | INH000030287
관련 발행물
면책사항
해당 정보와 게시물은 금융, 투자, 트레이딩 또는 기타 유형의 조언이나 권장 사항으로 간주되지 않으며, 트레이딩뷰에서 제공하거나 보증하는 것이 아닙니다. 자세한 내용은 이용 약관을 참조하세요.