
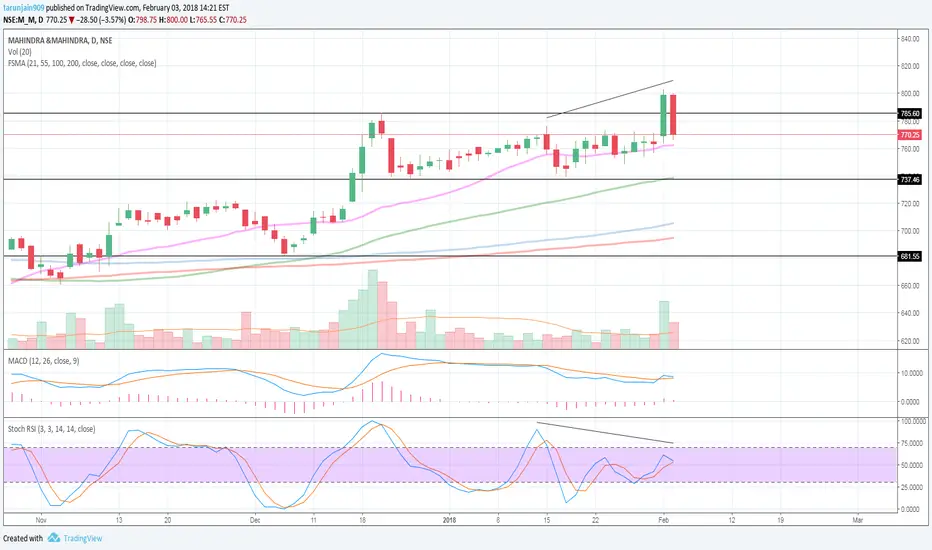
M&M showing signs of trend reversal here..
Signals -
1. RSI divergence
2. Overbought
3. Bearish Engulf Candle
Targets on the right in black.
This chart is for study/educational purpose only.
Please DYOR.
I won't be liable for any P/L made by using above chart.
Signals -
1. RSI divergence
2. Overbought
3. Bearish Engulf Candle
Targets on the right in black.
This chart is for study/educational purpose only.
Please DYOR.
I won't be liable for any P/L made by using above chart.
노트
As shown on chart, T1 and T2 are met.거래청산: 타겟 닿음

면책사항
해당 정보와 게시물은 금융, 투자, 트레이딩 또는 기타 유형의 조언이나 권장 사항으로 간주되지 않으며, 트레이딩뷰에서 제공하거나 보증하는 것이 아닙니다. 자세한 내용은 이용 약관을 참조하세요.
면책사항
해당 정보와 게시물은 금융, 투자, 트레이딩 또는 기타 유형의 조언이나 권장 사항으로 간주되지 않으며, 트레이딩뷰에서 제공하거나 보증하는 것이 아닙니다. 자세한 내용은 이용 약관을 참조하세요.