
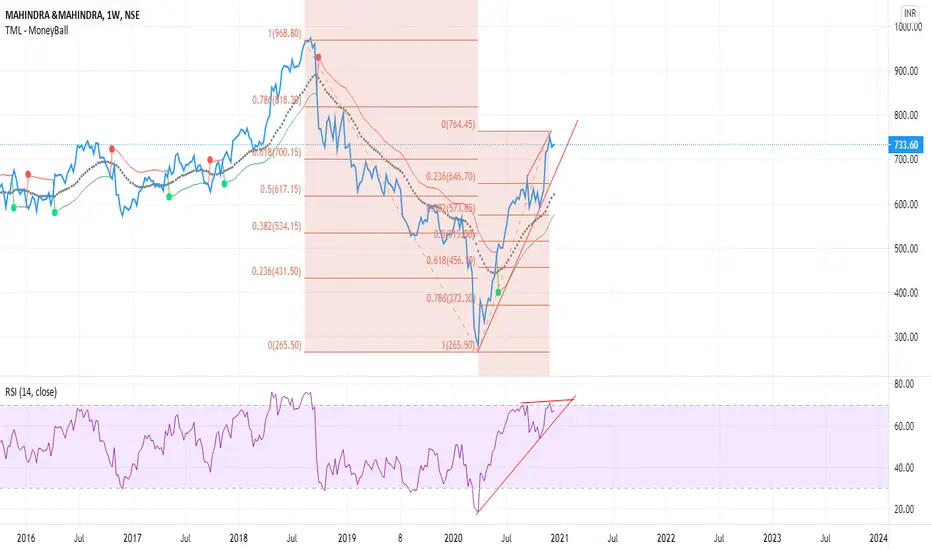
M&M on weekly time frames is poised to correct.
Currently, hidden negative divergences are clearly visible on the chart.
Even though, the price has established a new high post-September 2020 however, RSI failed to establish a new high and its the first sign of loss of momentum.
Applying the Elliot wave theory
From march lows of 250 and recent highs of 760 - we can consider this as wave 1
Wave 2 - Usually corrects up to 61.% fibo levels which comes down to 450. However, 570 & 500 are also crucial levels to watch for any reversal signs.
Currently, hidden negative divergences are clearly visible on the chart.
Even though, the price has established a new high post-September 2020 however, RSI failed to establish a new high and its the first sign of loss of momentum.
Applying the Elliot wave theory
From march lows of 250 and recent highs of 760 - we can consider this as wave 1
Wave 2 - Usually corrects up to 61.% fibo levels which comes down to 450. However, 570 & 500 are also crucial levels to watch for any reversal signs.
노트
M&M saw a massive fall of over 7% today and made a low of 660. 640-650 is strong support since its 23.6% fibbo level... it is likely the stock will bounce from these levels to further test the 570-500 levels in future.

면책사항
해당 정보와 게시물은 금융, 투자, 트레이딩 또는 기타 유형의 조언이나 권장 사항으로 간주되지 않으며, 트레이딩뷰에서 제공하거나 보증하는 것이 아닙니다. 자세한 내용은 이용 약관을 참조하세요.
면책사항
해당 정보와 게시물은 금융, 투자, 트레이딩 또는 기타 유형의 조언이나 권장 사항으로 간주되지 않으며, 트레이딩뷰에서 제공하거나 보증하는 것이 아닙니다. 자세한 내용은 이용 약관을 참조하세요.