업데이트됨
NANOBTC
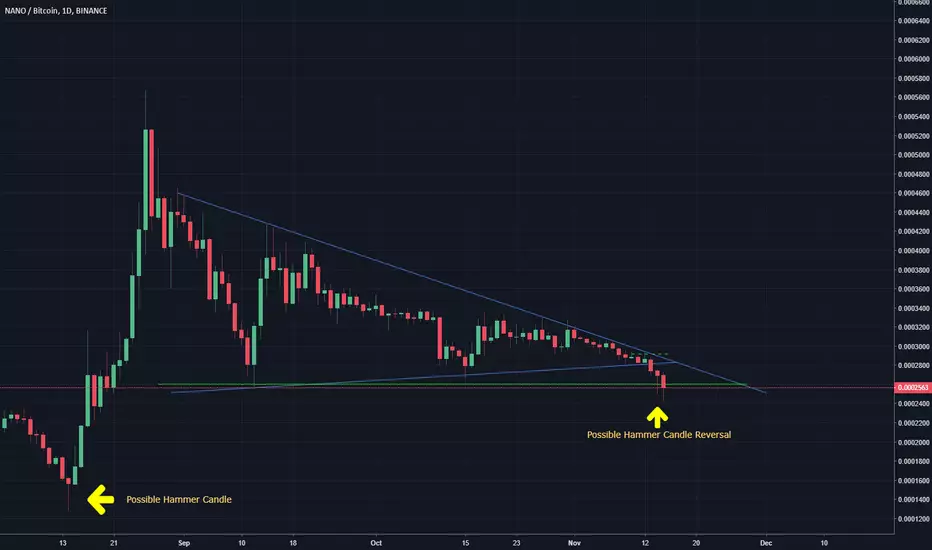
NANO-BTC on 1D Chart
Let's not give up on all hope...yet!
Facts to work on:
- We've seen NANO forming an almost symmetrical triangle pattern which was almost set up for breakout (but BTC decided to fall...or whales decided :D )
- the green line is what I consider a readjusted base line for the triangle formation
- we are currently touching this line and we may as well see a bounce from this price level.
- I would also like to belive in a hammer reversal candle for yesterday's close on daily, so let's keep an eye on today's price action and how we will close
* see the last hammer reversal candle from 14th August.
I am looking forward for other suggestions regarding possible upcoming price actions.
I'll keep posting on this, since my entry was at the green dotted line level just a few days ago.
Let's not give up on all hope...yet!
Facts to work on:
- We've seen NANO forming an almost symmetrical triangle pattern which was almost set up for breakout (but BTC decided to fall...or whales decided :D )
- the green line is what I consider a readjusted base line for the triangle formation
- we are currently touching this line and we may as well see a bounce from this price level.
- I would also like to belive in a hammer reversal candle for yesterday's close on daily, so let's keep an eye on today's price action and how we will close
* see the last hammer reversal candle from 14th August.
I am looking forward for other suggestions regarding possible upcoming price actions.
I'll keep posting on this, since my entry was at the green dotted line level just a few days ago.
거래청산: 스탑 닿음

면책사항
해당 정보와 게시물은 금융, 투자, 트레이딩 또는 기타 유형의 조언이나 권장 사항으로 간주되지 않으며, 트레이딩뷰에서 제공하거나 보증하는 것이 아닙니다. 자세한 내용은 이용 약관을 참조하세요.
면책사항
해당 정보와 게시물은 금융, 투자, 트레이딩 또는 기타 유형의 조언이나 권장 사항으로 간주되지 않으며, 트레이딩뷰에서 제공하거나 보증하는 것이 아닙니다. 자세한 내용은 이용 약관을 참조하세요.