
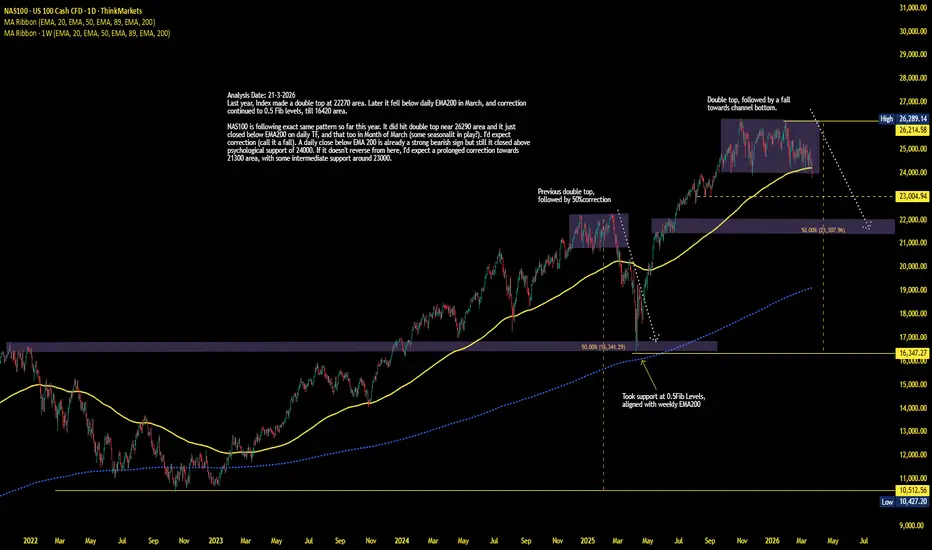
Last year, NAS100 made a double top around 22270 area. Later it fell below daily EMA200 in March, and correction continued to 0.5 Fib levels, till 16420 area.
NAS100 is following exact same pattern so far this year. It did hit double top near 26290 area and it just closed below EMA200 on daily TF, and that too in Month of March (some seasonality in play?). I'd expect correction (call it a fall). A daily close below EMA 200 is already a strong bearish sign but still it closed above psychological support of 24000. If it doesn't reverse from here, I'd expect a prolonged correction towards 21300 area (0.5Fib levels), with some intermediate support around 23000.
NAS100 is following exact same pattern so far this year. It did hit double top near 26290 area and it just closed below EMA200 on daily TF, and that too in Month of March (some seasonality in play?). I'd expect correction (call it a fall). A daily close below EMA 200 is already a strong bearish sign but still it closed above psychological support of 24000. If it doesn't reverse from here, I'd expect a prolonged correction towards 21300 area (0.5Fib levels), with some intermediate support around 23000.
액티브 트레이드
falling as expected, reaching first support zone near 23000.거래청산: 타겟 닿음
NASDAQ100 took support at 23000, and bounced.
📊 Charts → 🏗️ Structure → 🎯 Probability =📖 Chart Story
⏳ Patience → 🚀Success
🎯 If this setup makes sense to you, show it some support with a Boost.
⏳ Patience → 🚀Success
🎯 If this setup makes sense to you, show it some support with a Boost.
면책사항
해당 정보와 게시물은 금융, 투자, 트레이딩 또는 기타 유형의 조언이나 권장 사항으로 간주되지 않으며, 트레이딩뷰에서 제공하거나 보증하는 것이 아닙니다. 자세한 내용은 이용 약관을 참조하세요.
📊 Charts → 🏗️ Structure → 🎯 Probability =📖 Chart Story
⏳ Patience → 🚀Success
🎯 If this setup makes sense to you, show it some support with a Boost.
⏳ Patience → 🚀Success
🎯 If this setup makes sense to you, show it some support with a Boost.
면책사항
해당 정보와 게시물은 금융, 투자, 트레이딩 또는 기타 유형의 조언이나 권장 사항으로 간주되지 않으며, 트레이딩뷰에서 제공하거나 보증하는 것이 아닙니다. 자세한 내용은 이용 약관을 참조하세요.