
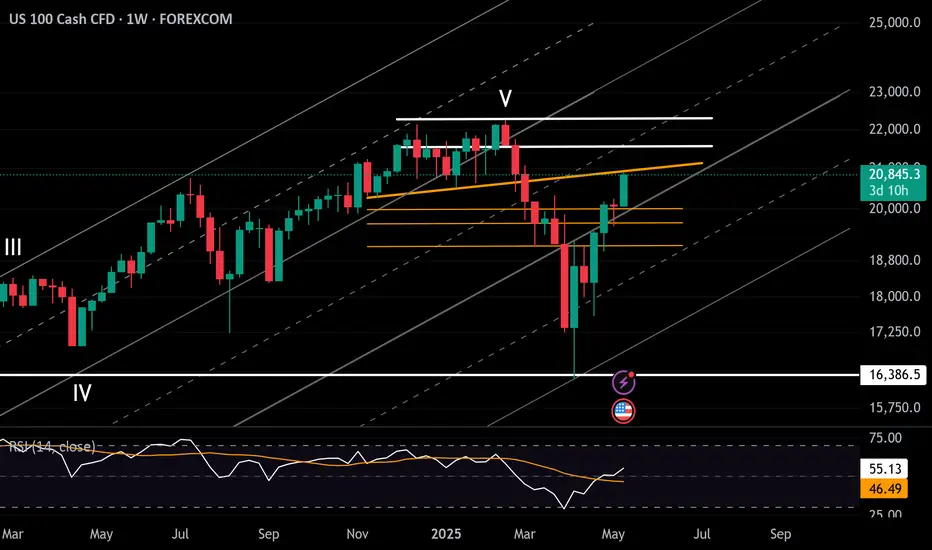
As shown in chart above, price action is hovering near the neckline of a well-defined double top pattern, formed between December 2024 and February 2025, similarly across the Dow and SPX500 charts.
This reinforces a key resistance zone that could either validate a more sustainable bullish outlook into 2025 — or trigger another correction if rejected.
Nasdaq Upside Scenario: A confirmed hold above 20,900 may extend gains toward 21,500, and 22,200.
Downside Scenario: A pullback below 20900 and 20,500 could find support at 20,200, 19,600, and 19,170, respectively.
Markets are currently holding on trade optimism, yet key economic reports are likely to test the narrative
Written by Razan Hilal, CMT
This reinforces a key resistance zone that could either validate a more sustainable bullish outlook into 2025 — or trigger another correction if rejected.
Nasdaq Upside Scenario: A confirmed hold above 20,900 may extend gains toward 21,500, and 22,200.
Downside Scenario: A pullback below 20900 and 20,500 could find support at 20,200, 19,600, and 19,170, respectively.
Markets are currently holding on trade optimism, yet key economic reports are likely to test the narrative
Written by Razan Hilal, CMT

면책사항
해당 정보와 게시물은 금융, 투자, 트레이딩 또는 기타 유형의 조언이나 권장 사항으로 간주되지 않으며, 트레이딩뷰에서 제공하거나 보증하는 것이 아닙니다. 자세한 내용은 이용 약관을 참조하세요.
면책사항
해당 정보와 게시물은 금융, 투자, 트레이딩 또는 기타 유형의 조언이나 권장 사항으로 간주되지 않으며, 트레이딩뷰에서 제공하거나 보증하는 것이 아닙니다. 자세한 내용은 이용 약관을 참조하세요.