
Nasdaq Index
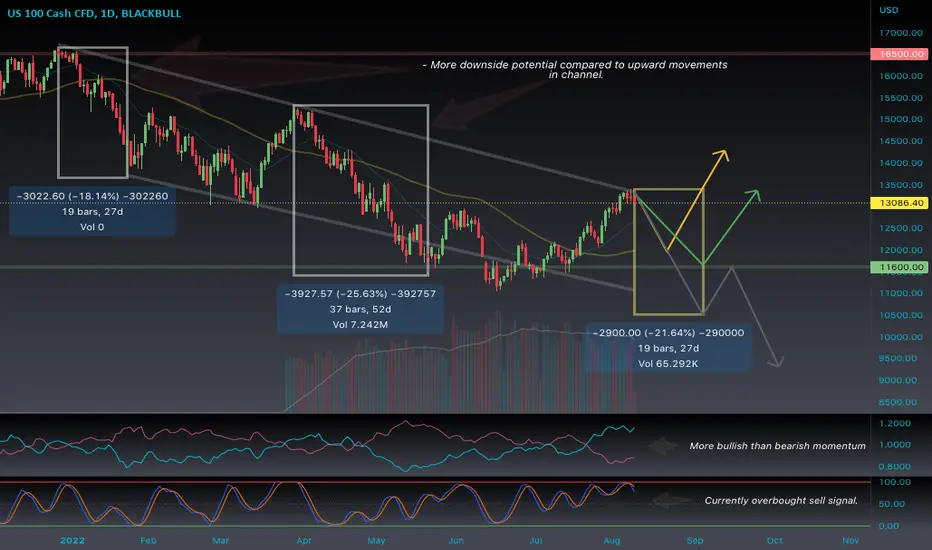
- Price been trending downward since the end of December 2021 and forming a channel chart pattern.
- Obviously more downside rather than upside potential ranging from 3K-3.9K in points. Downtrend is starting to weaken according to moving averages and and vortex sub chart indicator.
- Colored arrows represents 3 scenarios that could play out if price continue to trade within and/or breakout.
- Price been trending downward since the end of December 2021 and forming a channel chart pattern.
- Obviously more downside rather than upside potential ranging from 3K-3.9K in points. Downtrend is starting to weaken according to moving averages and and vortex sub chart indicator.
- Colored arrows represents 3 scenarios that could play out if price continue to trade within and/or breakout.

면책사항
해당 정보와 게시물은 금융, 투자, 트레이딩 또는 기타 유형의 조언이나 권장 사항으로 간주되지 않으며, 트레이딩뷰에서 제공하거나 보증하는 것이 아닙니다. 자세한 내용은 이용 약관을 참조하세요.
면책사항
해당 정보와 게시물은 금융, 투자, 트레이딩 또는 기타 유형의 조언이나 권장 사항으로 간주되지 않으며, 트레이딩뷰에서 제공하거나 보증하는 것이 아닙니다. 자세한 내용은 이용 약관을 참조하세요.