 NAS100 NAS100 NAS100 NAS100USD
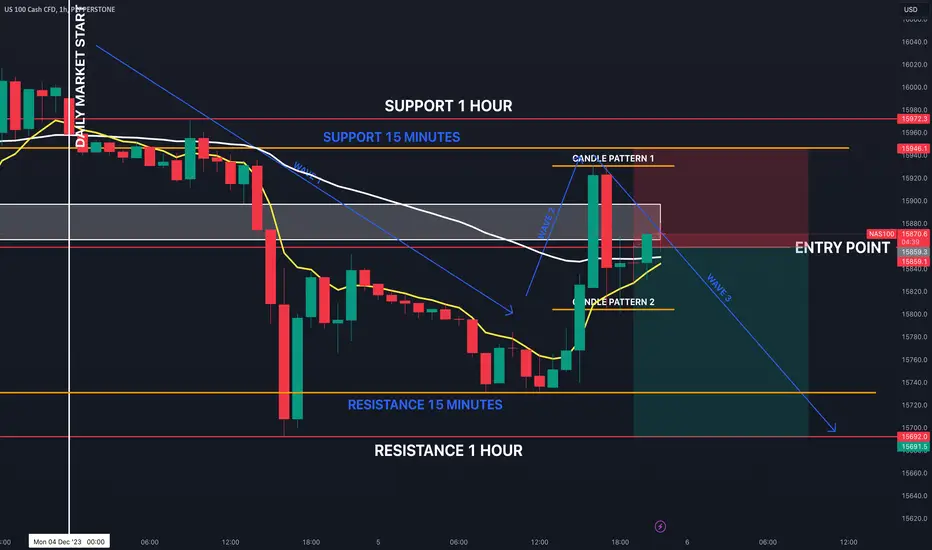
Hello everyone, upon watching closely multiple timeframes where I combine a few types of chart analysis (support & resistance, candlestick patterns, breakout strategy, etc.) I'm thinking NAS100 will go bearish, at least temporarily, because ultimately the price movement in the charts tell us all, and my goal is always to read it right.
That chart I'm sharing with you is pretty self explanatory.
Make sure to comment your thoughts below and let me know any questions you might have if you have any.
My goal is to try and always be helpful, and while I sometimes fail (I'm a human not a robot) I do my best to always be better, and I never see failure as the final destination.
If you got to this point, happy profiting!

면책사항
해당 정보와 게시물은 금융, 투자, 트레이딩 또는 기타 유형의 조언이나 권장 사항으로 간주되지 않으며, 트레이딩뷰에서 제공하거나 보증하는 것이 아닙니다. 자세한 내용은 이용 약관을 참조하세요.
면책사항
해당 정보와 게시물은 금융, 투자, 트레이딩 또는 기타 유형의 조언이나 권장 사항으로 간주되지 않으며, 트레이딩뷰에서 제공하거나 보증하는 것이 아닙니다. 자세한 내용은 이용 약관을 참조하세요.