
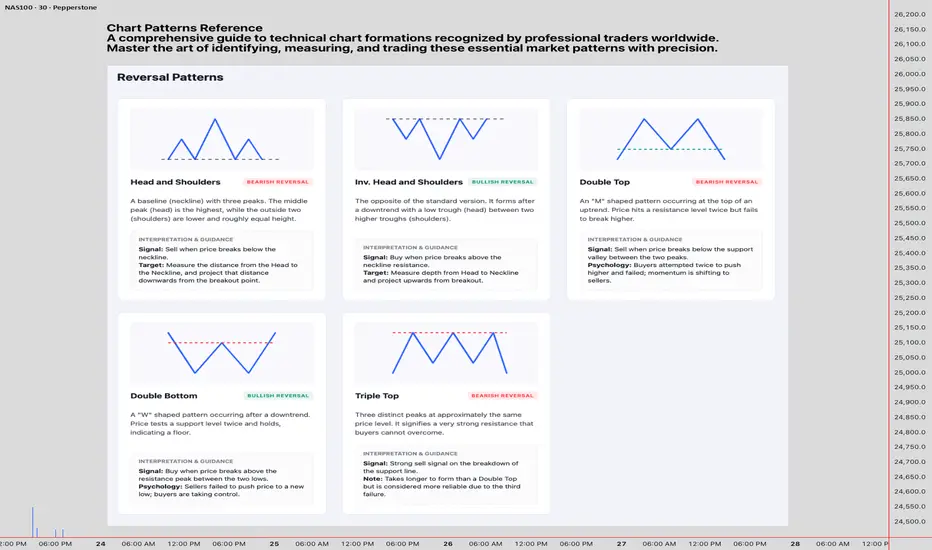
A comprehensive guide to technical chart formations recognized by professional traders worldwide. Master the art of identifying, measuring, and trading these essential market patterns with precision.
Reversal Patterns:-
Head and Shoulders
Bearish Reversal
A baseline (neckline) with three peaks. The middle peak (head) is the highest, while the outside two (shoulders) are lower and roughly equal height.
Interpretation & Guidance
Signal: Sell when price breaks below the neckline.
Target: Measure the distance from the Head to the Neckline, and project that distance downwards from the breakout point.
Inv. Head and Shoulders
Bullish Reversal
The opposite of the standard version. It forms after a downtrend with a low trough (head) between two higher troughs (shoulders).
Interpretation & Guidance
Signal: Buy when price breaks above the neckline resistance.
Target: Measure depth from Head to Neckline and project upwards from breakout.
Double Top
Bearish Reversal
An "M" shaped pattern occurring at the top of an uptrend. Price hits a resistance level twice but fails to break higher.
Interpretation & Guidance
Signal: Sell when price breaks below the support valley between the two peaks.
Psychology: Buyers attempted twice to push higher and failed; momentum is shifting to sellers.
Double Bottom
Bullish Reversal
A "W" shaped pattern occurring after a downtrend. Price tests a support level twice and holds, indicating a floor.
Interpretation & Guidance
Signal: Buy when price breaks above the resistance peak between the two lows.
Psychology: Sellers failed to push price to a new low; buyers are taking control.
Triple Top
Bearish Reversal
Three distinct peaks at approximately the same price level. It signifies a very strong resistance that buyers cannot overcome.
Interpretation & Guidance
Signal: Strong sell signal on the breakdown of the support line.
Note: Takes longer to form than a Double Top but is considered more reliable due to the third failure.
Reversal Patterns:-
Head and Shoulders
Bearish Reversal
A baseline (neckline) with three peaks. The middle peak (head) is the highest, while the outside two (shoulders) are lower and roughly equal height.
Interpretation & Guidance
Signal: Sell when price breaks below the neckline.
Target: Measure the distance from the Head to the Neckline, and project that distance downwards from the breakout point.
Inv. Head and Shoulders
Bullish Reversal
The opposite of the standard version. It forms after a downtrend with a low trough (head) between two higher troughs (shoulders).
Interpretation & Guidance
Signal: Buy when price breaks above the neckline resistance.
Target: Measure depth from Head to Neckline and project upwards from breakout.
Double Top
Bearish Reversal
An "M" shaped pattern occurring at the top of an uptrend. Price hits a resistance level twice but fails to break higher.
Interpretation & Guidance
Signal: Sell when price breaks below the support valley between the two peaks.
Psychology: Buyers attempted twice to push higher and failed; momentum is shifting to sellers.
Double Bottom
Bullish Reversal
A "W" shaped pattern occurring after a downtrend. Price tests a support level twice and holds, indicating a floor.
Interpretation & Guidance
Signal: Buy when price breaks above the resistance peak between the two lows.
Psychology: Sellers failed to push price to a new low; buyers are taking control.
Triple Top
Bearish Reversal
Three distinct peaks at approximately the same price level. It signifies a very strong resistance that buyers cannot overcome.
Interpretation & Guidance
Signal: Strong sell signal on the breakdown of the support line.
Note: Takes longer to form than a Double Top but is considered more reliable due to the third failure.

I am nothing @shunya.trade
면책사항
해당 정보와 게시물은 금융, 투자, 트레이딩 또는 기타 유형의 조언이나 권장 사항으로 간주되지 않으며, 트레이딩뷰에서 제공하거나 보증하는 것이 아닙니다. 자세한 내용은 이용 약관을 참조하세요.
I am nothing @shunya.trade
면책사항
해당 정보와 게시물은 금융, 투자, 트레이딩 또는 기타 유형의 조언이나 권장 사항으로 간주되지 않으며, 트레이딩뷰에서 제공하거나 보증하는 것이 아닙니다. 자세한 내용은 이용 약관을 참조하세요.