
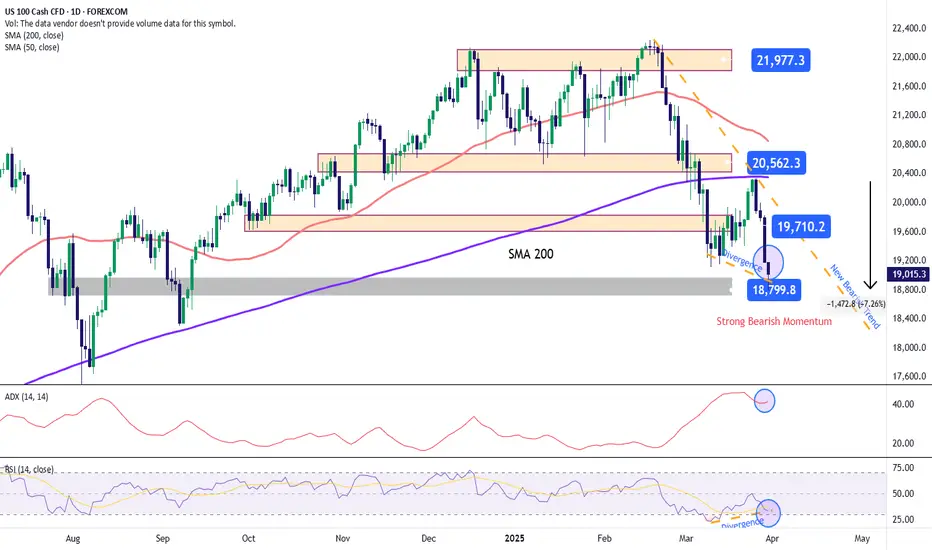
The Nasdaq has been one of the indices showing the strongest selling bias in recent sessions. Over the past four trading days, it has fallen by more than 7%, as the market remains gripped by uncertainty surrounding White House trade policies and the threat of a new trade war. The proposed 25% tariffs on several countries are expected to take effect on April 2, and so far, there has been no official indication of a change in schedule. This has increased fears of a potential global economic slowdown, and if these conditions persist, it could further pressure equity indices, especially those already showing strong short-term bearish momentum.
New Potential Downtrend
Since February 20, the Nasdaq has been experiencing consistent selling pressure, driving the index below the 19,000-point level. Recent bullish attempts have so far failed to break through this new downward trendline, which now stands as the dominant technical structure for the index. If selling pressure remains intact, the current bearish trend could extend over the coming sessions.
ADX Indicator
Although the ADX line remains above the 20 level—generally considered the threshold for trend strength—it has been sloping downward, suggesting that the recent buying momentum may be losing strength, potentially leading to a short-term pause in market activity.
RSI Indicator
The Relative Strength Index (RSI) shows a similar picture. The RSI is hovering near the oversold zone at 30, and a bullish divergence has formed, as the Nasdaq has made lower lows, while the RSI has posted higher lows. This could indicate that selling momentum may be weakening, potentially paving the way for a short-term bullish correction.
Key Levels:
By Julian Pineda, CFA – Market Analyst
New Potential Downtrend
Since February 20, the Nasdaq has been experiencing consistent selling pressure, driving the index below the 19,000-point level. Recent bullish attempts have so far failed to break through this new downward trendline, which now stands as the dominant technical structure for the index. If selling pressure remains intact, the current bearish trend could extend over the coming sessions.
ADX Indicator
Although the ADX line remains above the 20 level—generally considered the threshold for trend strength—it has been sloping downward, suggesting that the recent buying momentum may be losing strength, potentially leading to a short-term pause in market activity.
RSI Indicator
The Relative Strength Index (RSI) shows a similar picture. The RSI is hovering near the oversold zone at 30, and a bullish divergence has formed, as the Nasdaq has made lower lows, while the RSI has posted higher lows. This could indicate that selling momentum may be weakening, potentially paving the way for a short-term bullish correction.
Key Levels:
- 20,500 points – Distant resistance: This level aligns with the 200-period moving average. Price action approaching this area could revive bullish sentiment and potentially invalidate the current downtrend visible on the chart.
- 19,700 points – Near resistance: This level marks the upper boundary of the short-term descending trendline. It may serve as a tentative area for corrective upward movements in the upcoming sessions.
- 18,800 points – Key support: This level corresponds to 2024’s neutral price zone. If the price breaks below it, it could reinforce the current bearish trend and lead to further downside.
By Julian Pineda, CFA – Market Analyst

면책사항
해당 정보와 게시물은 금융, 투자, 트레이딩 또는 기타 유형의 조언이나 권장 사항으로 간주되지 않으며, 트레이딩뷰에서 제공하거나 보증하는 것이 아닙니다. 자세한 내용은 이용 약관을 참조하세요.
면책사항
해당 정보와 게시물은 금융, 투자, 트레이딩 또는 기타 유형의 조언이나 권장 사항으로 간주되지 않으며, 트레이딩뷰에서 제공하거나 보증하는 것이 아닙니다. 자세한 내용은 이용 약관을 참조하세요.