
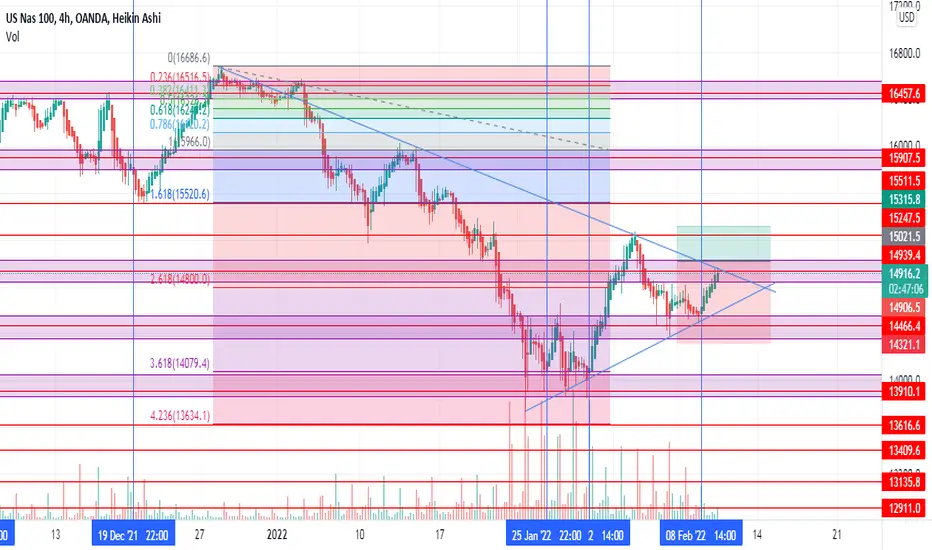
On the Daily timeframe we see a clear downtrend. It touches the trendline more than 5 times, indicating the correct direction of the market. If the market breaks the trendline it should head to the 15072.9 area. On the 4H we see some price action in the key area or golden area, the 618 on the Fibonacci retracement. If it does not break the trendline, it should come down to 14649.3 whhere it should bounce off the trendline and go up.

면책사항
해당 정보와 게시물은 금융, 투자, 트레이딩 또는 기타 유형의 조언이나 권장 사항으로 간주되지 않으며, 트레이딩뷰에서 제공하거나 보증하는 것이 아닙니다. 자세한 내용은 이용 약관을 참조하세요.
면책사항
해당 정보와 게시물은 금융, 투자, 트레이딩 또는 기타 유형의 조언이나 권장 사항으로 간주되지 않으며, 트레이딩뷰에서 제공하거나 보증하는 것이 아닙니다. 자세한 내용은 이용 약관을 참조하세요.