
Sep 11 2024
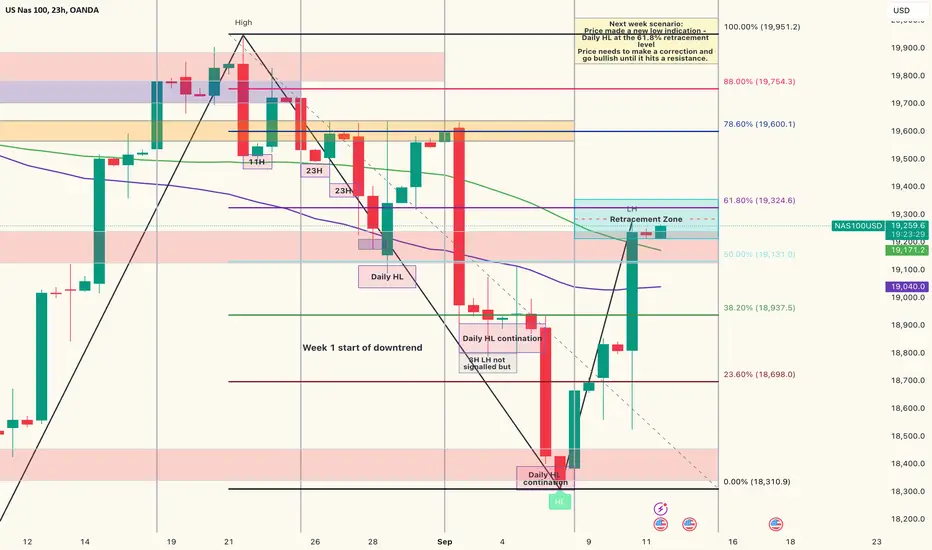
We got over a 700point move today where price surpassed my TPs for the week reaching a high of 19,274.1. This now puts the 23H TF is the biggest TF to signal it's LH which now sits at the 62.8% retracement level on the fib.

Now that price has made its bullish correction, I am now shifting my bias to sells for it to make its new low point on the bigger TF.
Each red zone represents a bearish level of resistance where price previously retraced from after making a bullish correction.

Therefore I am now looking for signs of retracements anywhere between 19,274.1 - 19,322.5 for the following reasons:
1. Price is at the bearish level of resistance
2. Price is at the 61.8% key retracement fib level
3. Price would be respecting the daily moving averages
4. Price has been bullish since Monday with only a 1H Low signalled.
Note, that if price does not retrace within this range (9,274.1 - 19,322.5) and it closes above, then price will continue bullish up to the 78.6% retracement level at 19,597.9.
Here are two scenarios for the rest of the week:
Downtrend (more likely):
- Price begins to retrace within the retracement zone highlighted in blue to signal a 4H HL roughly around 18,934.8.
- This would mean that today marked the day price made it's highest point for the week and will now retrace for the rest of the week.
Uptrend continuations (unlikely but also possible for strong uptrend)
- Price makes a series of HHs and HLs on the smaller TFs so that it can continue to break above the retracement zone.
- Once it breaks above, the next TP of interest is 19,597.9
- This means that price will continue bullish for the rest of the week with Thursday having the most volume and Friday ranging with consolidations.
We got over a 700point move today where price surpassed my TPs for the week reaching a high of 19,274.1. This now puts the 23H TF is the biggest TF to signal it's LH which now sits at the 62.8% retracement level on the fib.
Now that price has made its bullish correction, I am now shifting my bias to sells for it to make its new low point on the bigger TF.
Each red zone represents a bearish level of resistance where price previously retraced from after making a bullish correction.
Therefore I am now looking for signs of retracements anywhere between 19,274.1 - 19,322.5 for the following reasons:
1. Price is at the bearish level of resistance
2. Price is at the 61.8% key retracement fib level
3. Price would be respecting the daily moving averages
4. Price has been bullish since Monday with only a 1H Low signalled.
Note, that if price does not retrace within this range (9,274.1 - 19,322.5) and it closes above, then price will continue bullish up to the 78.6% retracement level at 19,597.9.
Here are two scenarios for the rest of the week:
Downtrend (more likely):
- Price begins to retrace within the retracement zone highlighted in blue to signal a 4H HL roughly around 18,934.8.
- This would mean that today marked the day price made it's highest point for the week and will now retrace for the rest of the week.
Uptrend continuations (unlikely but also possible for strong uptrend)
- Price makes a series of HHs and HLs on the smaller TFs so that it can continue to break above the retracement zone.
- Once it breaks above, the next TP of interest is 19,597.9
- This means that price will continue bullish for the rest of the week with Thursday having the most volume and Friday ranging with consolidations.

면책사항
해당 정보와 게시물은 금융, 투자, 트레이딩 또는 기타 유형의 조언이나 권장 사항으로 간주되지 않으며, 트레이딩뷰에서 제공하거나 보증하는 것이 아닙니다. 자세한 내용은 이용 약관을 참조하세요.
면책사항
해당 정보와 게시물은 금융, 투자, 트레이딩 또는 기타 유형의 조언이나 권장 사항으로 간주되지 않으며, 트레이딩뷰에서 제공하거나 보증하는 것이 아닙니다. 자세한 내용은 이용 약관을 참조하세요.