
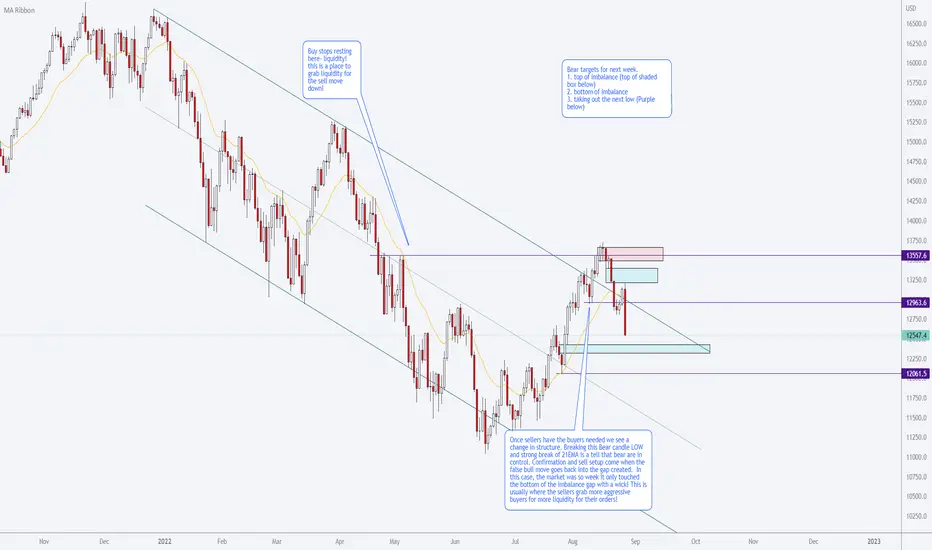
How to know the uptrend changed - where do the sellers take control? How do you read the chart and see the sellers push buyers into the trap. Nice example of where the buyers that looked for continuation of the uptrend missed the story the chart was telling. Good less that trendlines are only PART of the picture. So where are we going from here? I see some short term targets below to look for in the coming week. Note these are areas of PA interest, not trade calls or callouts to short the NQ market! Educational purposes only here. Trade your own account as you see fit and happy trading!
노트
We are looking to get buyers up into this pink liquidity void. The better sell area will be above in the potential order block above (Blue) The idea being we are still bearish in HTFs and Sellers need some buyside before taking out lower targets. Daily/Intraday setups that give good R:R will be looked for on the LTFs. Lets see how we go. Happy trading! 
Happy trading folks
- Doc
ps - see my profile for X profile where i show trades taken and tracked screenshots
- Doc
ps - see my profile for X profile where i show trades taken and tracked screenshots
관련 발행물
면책사항
해당 정보와 게시물은 금융, 투자, 트레이딩 또는 기타 유형의 조언이나 권장 사항으로 간주되지 않으며, 트레이딩뷰에서 제공하거나 보증하는 것이 아닙니다. 자세한 내용은 이용 약관을 참조하세요.
Happy trading folks
- Doc
ps - see my profile for X profile where i show trades taken and tracked screenshots
- Doc
ps - see my profile for X profile where i show trades taken and tracked screenshots
관련 발행물
면책사항
해당 정보와 게시물은 금융, 투자, 트레이딩 또는 기타 유형의 조언이나 권장 사항으로 간주되지 않으며, 트레이딩뷰에서 제공하거나 보증하는 것이 아닙니다. 자세한 내용은 이용 약관을 참조하세요.