
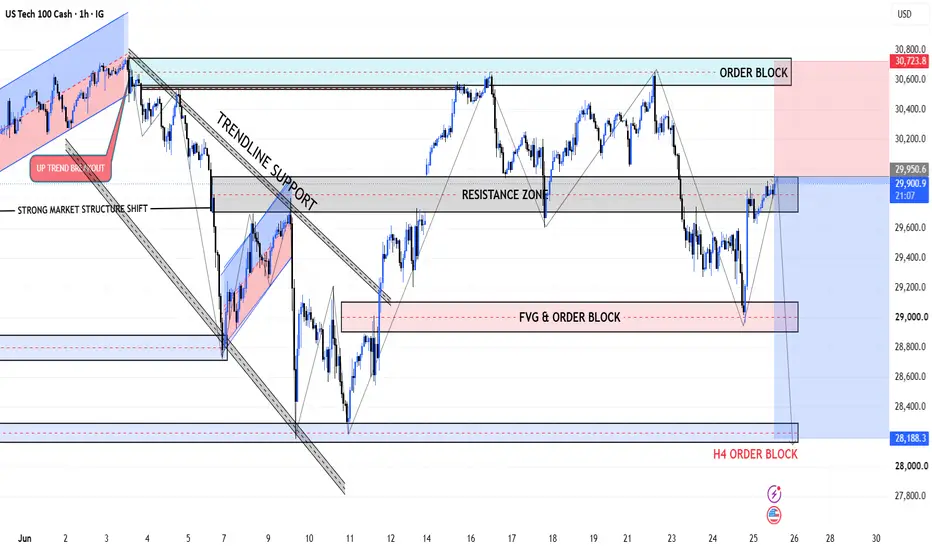
US Tech 100 is currently trading around 29,910, where price has returned into a major resistance zone (29,700 – 29,950) after a strong bullish recovery from the FVG & Order Block demand area near 29,000. The market recently created a sharp bullish reaction from this institutional demand zone, confirming that buyers are still active in the short term. However, price is now testing a critical resistance level that previously acted as a strong market structure point.
The upper Order Block around 30,650 – 30,750 remains the key supply area. As long as price stays below this zone, sellers may maintain control and push the market lower. The current rally appears to be a retracement into resistance after a bearish impulsive move, increasing the probability of another downside continuation.
The highlighted resistance zone around 29,700 – 29,950 is the decision area for the next move. A rejection from this zone could trigger fresh selling pressure toward the lower liquidity areas and institutional demand levels. On the other hand, a strong breakout and hourly close above 29,950 would invalidate the immediate bearish outlook and open the path toward the higher order block.
Market structure remains mixed, but the overall bias favors a bearish reaction while price trades inside resistance. Traders should watch for bearish confirmation candles, liquidity sweeps, or rejection patterns before entering sell positions.
SELL ENTRY
Entry: 29,900 – 29,950
Stop Loss: 30,750
Take Profit 1 (TP1): 29,400
Take Profit 2 (TP2): 29,000
Take Profit 3 (TP3): 28,200
The upper Order Block around 30,650 – 30,750 remains the key supply area. As long as price stays below this zone, sellers may maintain control and push the market lower. The current rally appears to be a retracement into resistance after a bearish impulsive move, increasing the probability of another downside continuation.
The highlighted resistance zone around 29,700 – 29,950 is the decision area for the next move. A rejection from this zone could trigger fresh selling pressure toward the lower liquidity areas and institutional demand levels. On the other hand, a strong breakout and hourly close above 29,950 would invalidate the immediate bearish outlook and open the path toward the higher order block.
Market structure remains mixed, but the overall bias favors a bearish reaction while price trades inside resistance. Traders should watch for bearish confirmation candles, liquidity sweeps, or rejection patterns before entering sell positions.
SELL ENTRY
Entry: 29,900 – 29,950
Stop Loss: 30,750
Take Profit 1 (TP1): 29,400
Take Profit 2 (TP2): 29,000
Take Profit 3 (TP3): 28,200

Join My VIP Free Signals Channel.✅
telegram.me/+ZNhfjlhXP3s4OWI1
For Daily LIVE Trades,
Join Free Telegram Channel ✅
telegram.me/+ZNhfjlhXP3s4OWI1
telegram.me/+ZNhfjlhXP3s4OWI1
For Daily LIVE Trades,
Join Free Telegram Channel ✅
telegram.me/+ZNhfjlhXP3s4OWI1
면책사항
해당 정보와 게시물은 금융, 투자, 트레이딩 또는 기타 유형의 조언이나 권장 사항으로 간주되지 않으며, 트레이딩뷰에서 제공하거나 보증하는 것이 아닙니다. 자세한 내용은 이용 약관을 참조하세요.
Join My VIP Free Signals Channel.✅
telegram.me/+ZNhfjlhXP3s4OWI1
For Daily LIVE Trades,
Join Free Telegram Channel ✅
telegram.me/+ZNhfjlhXP3s4OWI1
telegram.me/+ZNhfjlhXP3s4OWI1
For Daily LIVE Trades,
Join Free Telegram Channel ✅
telegram.me/+ZNhfjlhXP3s4OWI1
면책사항
해당 정보와 게시물은 금융, 투자, 트레이딩 또는 기타 유형의 조언이나 권장 사항으로 간주되지 않으며, 트레이딩뷰에서 제공하거나 보증하는 것이 아닙니다. 자세한 내용은 이용 약관을 참조하세요.