
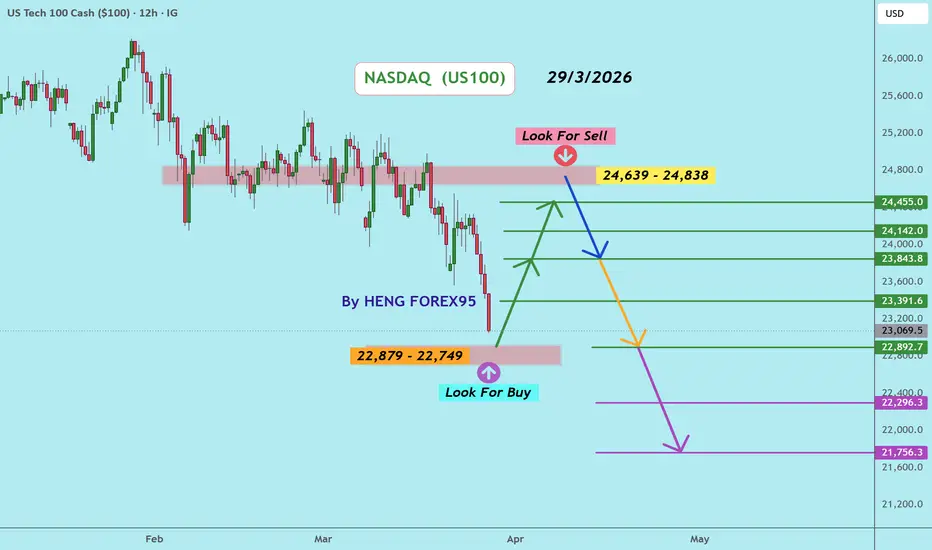
The Nasdaq index as a whole remains in a downtrend. Prices have a chance to test the support zone of $22879-$22749. If prices fail to break through $22749, a short-term rebound is possible.
Technically, if the price can remain above $22,643, we expect a short-term rebound is possible.
However, the Nasdaq index is still likely to face selling pressure, especially near the key resistance zone of $24,639-$24,838. If the price fails to break through $24,987, could present a high-probability opportunity for sellers to step back into the market, in line with the dominant downtrend.
🔥Trading futures, forex, CFDs and stocks carries a risk of loss.
Please consider carefully whether such trading is suitable for you.
This content is not financial advice. Always conduct your own financial due diligence.
>>GooD Luck 😊
❤️ Like and subscribe to never miss a new idea!
Technically, if the price can remain above $22,643, we expect a short-term rebound is possible.
However, the Nasdaq index is still likely to face selling pressure, especially near the key resistance zone of $24,639-$24,838. If the price fails to break through $24,987, could present a high-probability opportunity for sellers to step back into the market, in line with the dominant downtrend.
🔥Trading futures, forex, CFDs and stocks carries a risk of loss.
Please consider carefully whether such trading is suitable for you.
This content is not financial advice. Always conduct your own financial due diligence.
>>GooD Luck 😊
❤️ Like and subscribe to never miss a new idea!
노트
Buy status: target1: 6103 PIPS노트
Buy status: TP2: ++ 10423 PIPS
노트
Buy status:TP3: ++ 13322 PIPS
노트
Let's look at the trends on Monday, April 6, 2026.Trading Strategy: Buy Position
We can see that when the price rose to test the $24,168 level and failed to break through,
the price retraced. We still believe that if the price can remain above $23,405,
there is a chance that the price will rise again to test the resistance zone at $24,455.
Trading Strategy: Sell Position
However, the Nasdaq index is still likely to face selling pressure, especially near the key resistance zone of $24,639-$24,838. If the price fails to break through $24,987, could present a high-probability opportunity for sellers to step back into the market, in line with the dominant downtrend.
액티브 트레이드
Buy Position:Trade closed: target reached
TP4: Profit +15908 PIPS
_____________
Look for sell
Nasdaq Sell 24983

💎 HENG FOREX95 : Trading Community
• Free Trading Signals (Daily) 📈
• Best Broker Rates & Rebates ✅
• Partnership Support 🤝
🌐 Linktree (All Connections):
linktr.ee/hengforex95
• Free Trading Signals (Daily) 📈
• Best Broker Rates & Rebates ✅
• Partnership Support 🤝
🌐 Linktree (All Connections):
linktr.ee/hengforex95
관련 발행물
면책사항
해당 정보와 게시물은 금융, 투자, 트레이딩 또는 기타 유형의 조언이나 권장 사항으로 간주되지 않으며, 트레이딩뷰에서 제공하거나 보증하는 것이 아닙니다. 자세한 내용은 이용 약관을 참조하세요.
💎 HENG FOREX95 : Trading Community
• Free Trading Signals (Daily) 📈
• Best Broker Rates & Rebates ✅
• Partnership Support 🤝
🌐 Linktree (All Connections):
linktr.ee/hengforex95
• Free Trading Signals (Daily) 📈
• Best Broker Rates & Rebates ✅
• Partnership Support 🤝
🌐 Linktree (All Connections):
linktr.ee/hengforex95
관련 발행물
면책사항
해당 정보와 게시물은 금융, 투자, 트레이딩 또는 기타 유형의 조언이나 권장 사항으로 간주되지 않으며, 트레이딩뷰에서 제공하거나 보증하는 것이 아닙니다. 자세한 내용은 이용 약관을 참조하세요.