롱
NCASH Potential Bottom
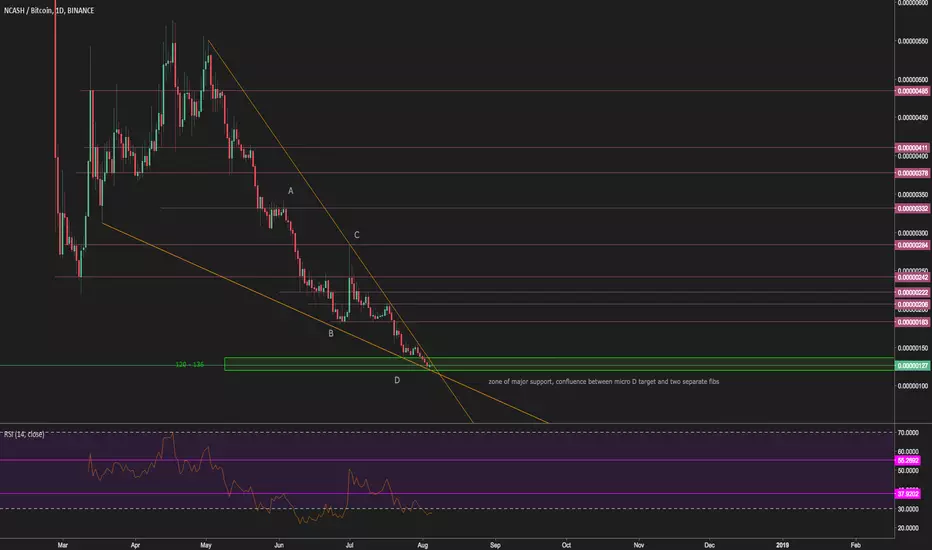
Ncash has seen a rough couple months. However we're now seeing an extremely oversold RSI in confluence with multiple fib levels and a strong trend extension (marked ABCD).
Here I'm looking for a potential bottom within the green box. Pink lines are simple levels of resistance, where price is likely to react. Any of these lines may be looked at as potential targets. I may post extra charts in comments to highlight the specific retracements I've used to find this zone.
Entry Zone : 120-136
Short Term Targets -
Target 1 : 160
Target 2 : 181
Target 3 : 203
Target 4 : 222
Long Term Targets -
Target 1 : 240
Target 2 : 282
Target 3 : 330
Target 4 : 375
Stop Loss : 111 (at your own discretion, this is my personal SL)
I'm not a financial advisor. Happy trading

면책사항
해당 정보와 게시물은 금융, 투자, 트레이딩 또는 기타 유형의 조언이나 권장 사항으로 간주되지 않으며, 트레이딩뷰에서 제공하거나 보증하는 것이 아닙니다. 자세한 내용은 이용 약관을 참조하세요.
면책사항
해당 정보와 게시물은 금융, 투자, 트레이딩 또는 기타 유형의 조언이나 권장 사항으로 간주되지 않으며, 트레이딩뷰에서 제공하거나 보증하는 것이 아닙니다. 자세한 내용은 이용 약관을 참조하세요.