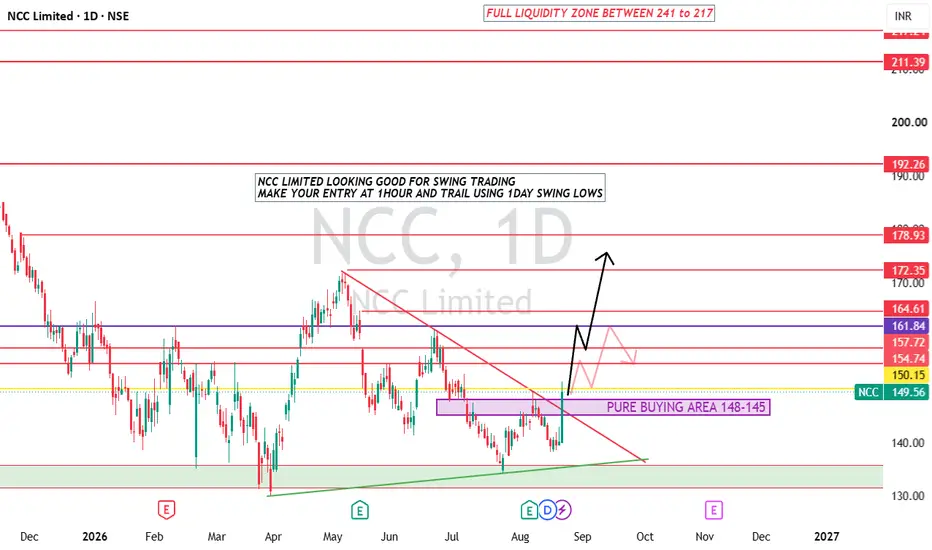
 NCC has broken out of a descending wedge continuation pattern on the daily chart. After forming a clear higher-low structure off the major ascending trendline, the stock confirmed strong demand with a +6.78% single-day impulse move. The price is expanding cleanly from the ₹145 – ₹148 demand zone.
Technical Parameters
Current Market Price: ₹149.56 (+6.78%)
Primary Accumulation Zone: ₹145.00 – ₹148.00 (Demand Floor / Value Area)
Immediate Support / Invalidated Below: ₹140.00 (Daily Swing Low)
Overhead Resistance Targets:
Target 1: ₹154.74 – ₹157.72 (First Pullback Level)
Target 2: ₹161.84 – ₹164.61 (Breakout Expansion Point)
Target 3: ₹172.35 – ₹178.93 (Intermediate Swing Highs)
Major Target: ₹192.26 – ₹211.39 (Upper Liquidity Zone)
Execution Plan
Entry Strategy: Look for execution on lower timeframes (1-Hour chart) on mild intraday pullbacks into the ₹145 – ₹148 zone.
Risk & Trailing: Trail risk progressively using 1-Day swing lows as the stock trends higher.
액티브 트레이드

면책사항
해당 정보와 게시물은 금융, 투자, 트레이딩 또는 기타 유형의 조언이나 권장 사항으로 간주되지 않으며, 트레이딩뷰에서 제공하거나 보증하는 것이 아닙니다. 자세한 내용은 이용 약관을 참조하세요.
면책사항
해당 정보와 게시물은 금융, 투자, 트레이딩 또는 기타 유형의 조언이나 권장 사항으로 간주되지 않으며, 트레이딩뷰에서 제공하거나 보증하는 것이 아닙니다. 자세한 내용은 이용 약관을 참조하세요.