
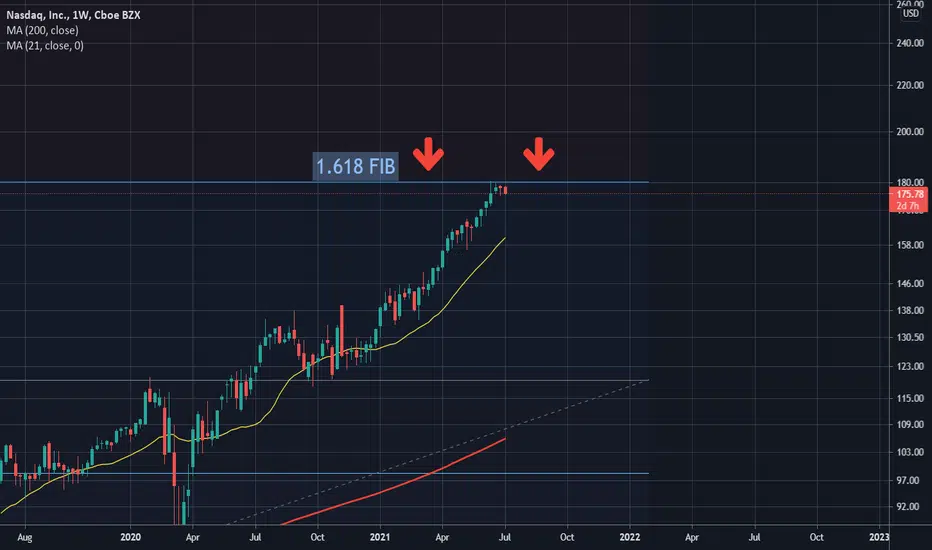
The weekly chart of the Nasdaq index is showing weakness with multiple weekly candle rejections at exactly the 1.618 fibonacci extension level.
This is key to note as the 1.618 as many know is often the first place traders short, sell and or take profits after price breaks all time high. So paying attention to the $180 level will be important. If bulls can ever get a weekly close above this level, the run up can continue.
Until then, proceed with caution this week and probably the next if your portfolio is very tech stock heavy.
This is key to note as the 1.618 as many know is often the first place traders short, sell and or take profits after price breaks all time high. So paying attention to the $180 level will be important. If bulls can ever get a weekly close above this level, the run up can continue.
Until then, proceed with caution this week and probably the next if your portfolio is very tech stock heavy.

관련 발행물
면책사항
해당 정보와 게시물은 금융, 투자, 트레이딩 또는 기타 유형의 조언이나 권장 사항으로 간주되지 않으며, 트레이딩뷰에서 제공하거나 보증하는 것이 아닙니다. 자세한 내용은 이용 약관을 참조하세요.
관련 발행물
면책사항
해당 정보와 게시물은 금융, 투자, 트레이딩 또는 기타 유형의 조언이나 권장 사항으로 간주되지 않으며, 트레이딩뷰에서 제공하거나 보증하는 것이 아닙니다. 자세한 내용은 이용 약관을 참조하세요.